RiskMize Documentation
Welcome to the comprehensive RiskMize documentation. This guide will help you understand every aspect of the platform, from basic navigation to advanced security assessment features. Whether you're a new user getting started or an experienced administrator managing complex operations, you'll find detailed information and step-by-step instructions throughout this documentation.
What is RiskMize?
RiskMize is a comprehensive geospatial risk intelligence platform designed to help organizations and security professionals monitor, analyze, and respond to security incidents worldwide. The platform combines real-time incident tracking, interactive mapping, advanced analytics, and collaborative team features to provide unparalleled situational awareness.
In today's interconnected world, security threats don't respect borders or time zones. A terrorist attack in one region, political unrest in another, or a natural disaster halfway around the world can all have significant impacts on your business operations, personnel safety, or travel plans. RiskMize brings all this critical information together in one powerful, easy-to-use platform that helps you stay ahead of emerging risks and make informed decisions quickly.
The platform serves a diverse range of users including corporate security teams protecting personnel and facilities worldwide, travel security managers assessing risks for business travelers, risk analysts identifying trends and forecasting threats, emergency management professionals coordinating responses, international organizations maintaining global situational awareness, and government agencies conducting open-source intelligence gathering.
Core Capabilities
🌍 Real-Time Global Intelligence
RiskMize monitors security incidents around the clock, providing up-to-the-minute information about events that could impact your operations. The platform aggregates data from verified news sources, government advisories, NGO reports, and vetted user submissions to create the most comprehensive view of global security conditions available.
Every incident is categorized by type (terrorism, crime, political unrest, natural disasters, health emergencies, cyber attacks), assigned a severity level (low, medium, high, critical), and tagged with precise geographic coordinates for accurate mapping. This structured approach ensures you can quickly find and analyze the incidents most relevant to your needs.
🗺️ Interactive Geospatial Visualization
The heart of RiskMize is its beautiful, responsive interactive map that plots every incident at its precise geographic location. Unlike simple lists or tables, the map lets you see patterns and hotspots instantly. Zoom from a global overview to street-level detail, pan across regions, and click incident markers to view comprehensive details.
The map uses intelligent clustering to group nearby incidents, preventing visual clutter while still showing you the density of activity in different areas. Color-coded markers make it easy to distinguish between different types of incidents at a glance, and customizable layers let you switch between street, satellite, and terrain views depending on your needs.
📊 Advanced Analytics and Reporting
Understanding today's incidents is important, but identifying trends and patterns over time is invaluable for strategic planning. RiskMize includes powerful analytics tools that transform raw incident data into actionable intelligence through visualizations, trend analysis, and comprehensive reporting.
Generate incident timelines showing frequency over days, weeks, months, or years. View category breakdowns revealing which types of incidents are most prevalent in your areas of interest. Analyze geographic distributions to identify emerging hotspots. Create custom reports in multiple formats (PDF, Excel, CSV, JSON) and schedule automatic delivery to stakeholders.
🛡️ Security Assessment Tools
One of RiskMize's most powerful features is the ability to conduct comprehensive security assessments for specific locations. Whether you're planning international travel, evaluating a potential office location, or preparing security measures for an event, the assessment engine analyzes historical and current data to generate detailed risk evaluations.
Assessments provide quantitative risk scores (0-100), identify specific risk factors with evidence from the data, show recent incident history in the area, and generate actionable recommendations for mitigating identified risks. This transforms subjective security concerns into objective, data-driven intelligence.
Key Features at a Glance
- Real-Time Incident Feed: Chronological display of security incidents as they're reported and verified, with automatic updates and real-time notifications.
- Interactive Global Map: Geospatial visualization with zoom, pan, clustering, and detailed incident popups showing all available information.
- Advanced Filtering: Search and filter by incident type, country/region, date range, severity level, and custom parameters to focus on what matters most.
- Security Assessments: Location-based risk analysis using historical data, current conditions, and predictive algorithms to evaluate safety.
- Analytics Dashboard: Comprehensive visualizations including timelines, category breakdowns, geographic distributions, and trend analysis.
- Custom Reports: Generate professional reports in multiple formats with configurable parameters, branding, and scheduled distribution.
- Team Collaboration: Share incidents, assessments, and reports with team members, add comments and discussions, and maintain shared organizational intelligence.
- API Access: Programmatic access to all platform features through a REST API with webhooks for real-time integration with external systems.
- Mobile Responsive: Full functionality on desktop, tablet, and mobile devices with optimized touch interfaces and responsive layouts.
- Role-Based Access: Eight-tier permission system ensuring each user has appropriate access from basic free accounts to full administrative control.
Platform Architecture
RiskMize is built on modern, scalable architecture designed for performance, reliability, and security. The platform uses real-time database connections for instant updates, geospatial indexing for fast map rendering, distributed caching for optimal performance, and enterprise-grade security with encryption, authentication, and audit logging.
The system is designed to handle thousands of concurrent users and millions of historical incidents while maintaining sub-second response times. Regular backups, redundant infrastructure, and continuous monitoring ensure 99.9% uptime and data protection.
Getting Help and Support
This documentation provides comprehensive information about every aspect of RiskMize, but if you need additional assistance, our support team is ready to help. Enterprise customers have access to priority support including live chat during business hours and phone support for critical issues. All users can reach us via email at support@riskmize.com with typically 24-48 hour response times.
The documentation is organized into logical sections covering different aspects of the platform. Use the sidebar navigation to jump to specific topics, or read sequentially to build comprehensive understanding. Each section includes detailed explanations, step-by-step instructions, best practices, and troubleshooting guidance.
Getting Started
This section will guide you through your first steps with RiskMize, from accessing the platform to understanding the system requirements and interface. Whether you're an individual user, joining an organization, or setting up enterprise accounts, we'll help you get up and running quickly and efficiently.
System Requirements
RiskMize is a modern web application that works seamlessly across all major platforms without requiring any downloads or installations. Simply access the platform through your web browser from any device with an internet connection.
Supported Web Browsers
For the best experience, we recommend using the latest version of Google Chrome (version 90 or higher). Chrome provides optimal performance for the interactive map, real-time updates, and complex visualizations. The platform also works excellently on Mozilla Firefox (version 88+), Apple Safari (version 14+), and Microsoft Edge (version 90+).
We continuously test and optimize RiskMize across these browsers to ensure consistent functionality and performance. If you're using an older browser version, you may experience degraded performance or missing features, so we strongly recommend keeping your browser updated to the latest version.
Screen Resolution and Device Support
Desktop Computers: RiskMize works on any screen resolution above 1280x720 pixels, though we recommend 1920x1080 (Full HD) or higher for the best experience. Larger screens let you view more information simultaneously, see more of the map, and work more efficiently with multiple panels open.
Tablets: The platform is fully optimized for tablet devices with resolutions of 768x1024 or higher. On tablets, the interface adapts to provide touch-friendly controls, optimized panel layouts, and easy navigation. Popular tablets like iPad, iPad Pro, Samsung Galaxy Tab, and Microsoft Surface all provide excellent RiskMize experiences.
Mobile Phones: For on-the-go access, RiskMize works on mobile phones with resolutions of 360x640 or higher. The mobile interface prioritizes essential information, provides collapsible panels for efficient screen use, and includes touch-optimized controls for easy one-handed operation. Check critical incidents, view maps, and access security assessments from anywhere.
Internet Connection
A stable internet connection of at least 5 Mbps is recommended for optimal performance. This ensures smooth map rendering, quick incident loading, real-time updates without delay, and fast report generation. For basic functionality, lower speeds will work, but you may experience slightly slower loading times.
If you're accessing RiskMize from locations with limited connectivity, the platform includes intelligent caching that stores recently viewed data, reducing the amount of data transfer needed and providing a smoother experience even on slower connections.
Accessing the Platform
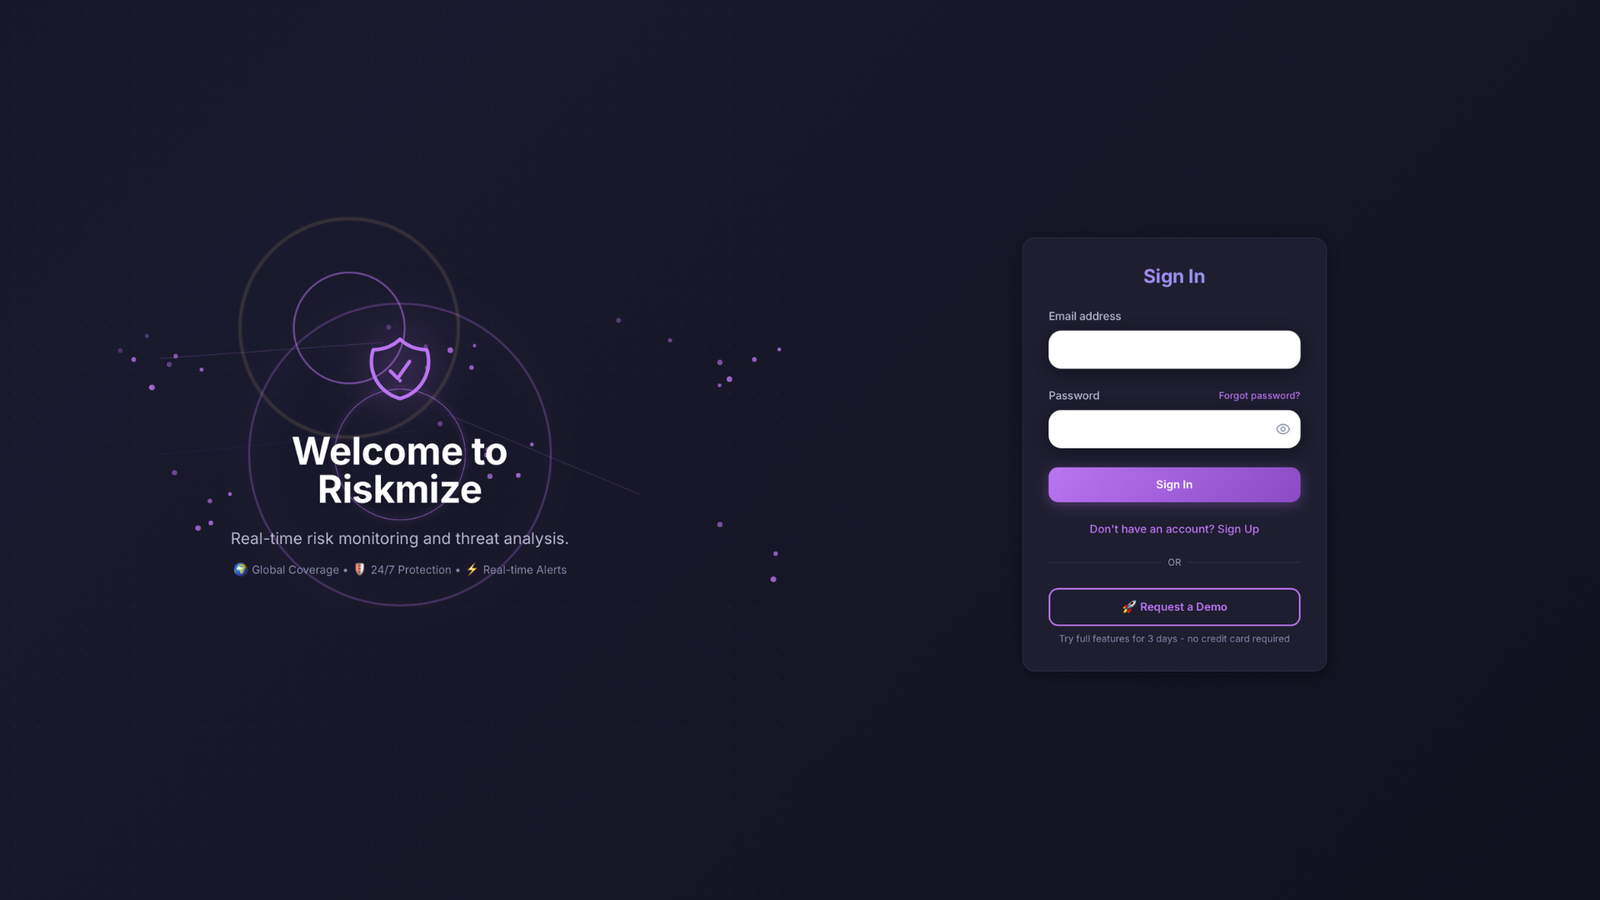
To begin using RiskMize, navigate to your organization's designated URL in your web browser. This might be the main platform address (typically provided during onboarding) or a custom branded domain if your organization has configured white-label access.
When you arrive at the login page, you'll see a clean, professional interface designed for security and ease of use. The page features the RiskMize logo, login form with email and password fields, "Remember Me" checkbox for trusted devices, "Forgot Password" link for account recovery, and "Sign Up" option for new users.
First-Time Setup
If you're accessing RiskMize for the first time, you'll need to either create a new account or accept an organization invitation. The process is designed to be quick and secure while gathering the minimum information needed to personalize your experience.
There are three ways to start using RiskMize: creating an individual account for personal or professional use, accepting an organization invitation if you've been invited by an enterprise admin, or starting a free trial to test the platform's capabilities before committing. Choose the path that best fits your situation.
Understanding the Interface
Once logged in, you'll land on the main dashboard - your command center for global security intelligence. Take a moment to familiarize yourself with the layout. The interface is divided into three main areas optimized for efficient workflow and quick access to information.
The left panel contains the incident feed showing recent security events in chronological order with real-time updates. The center panel displays the interactive global map with incident markers, zoom/pan controls, and layer options. The right panel shows quick statistics including total incidents (24 hours), category breakdowns, and top affected countries. The top navigation bar provides access to Analytics, Security Assessment, Settings, and user profile options.

Quick Start Checklist
To get the most out of RiskMize from day one, follow this quick start checklist:
- Complete Your Profile: Navigate to Settings and fill in your personal information, set your timezone for accurate incident timestamps, configure notification preferences, and set up two-factor authentication for enhanced security.
- Explore the Map: Try zooming in and out using mouse wheel or pinch gestures, click different incident markers to see details, experiment with different map layers (street, satellite, terrain), and practice using the search function to find specific locations.
- Apply Filters: Try filtering incidents by category to see specific threat types, select your country or region to focus locally, choose a date range to view historical incidents, and combine multiple filters to create custom views.
- Run a Security Assessment: If you have appropriate permissions, try creating an assessment for a location you know or care about, review the risk score and identified factors, and read through the generated recommendations.
- Generate a Report: Create a simple incident report covering the past week, try different export formats (PDF, Excel, CSV), and see how you might use these reports in your workflow.
By completing these initial steps, you'll gain hands-on experience with RiskMize's core features and be ready to integrate the platform into your security intelligence workflow. Don't hesitate to explore and experiment - the platform is designed to be intuitive and forgiving.
User Roles & Permissions
RiskMize employs a sophisticated eight-tier role-based access control (RBAC) system that ensures every user has exactly the right level of access for their responsibilities. This granular approach to permissions balances security, functionality, and ease of use, allowing organizations to grant appropriate access while maintaining data security and operational integrity.
Understanding the role hierarchy is essential for administrators managing teams and users trying to understand their capabilities within the platform. Each role builds upon the previous level, adding new permissions and features while maintaining access to all lower-tier functionality.
The Eight-Tier Role System
1. Standard User (Free Tier)
Access Level: Basic - Public Content Only
Standard users represent the entry point into RiskMize, providing valuable situational awareness without any financial commitment. This tier is perfect for individuals who want to monitor major global security events, students studying international relations or security studies, journalists tracking global incidents, or anyone interested in maintaining basic security awareness.
What Standard Users Can Do: View all publicly available global incidents that have been marked for public consumption, access the basic dashboard interface with map and incident feed, browse incident details including descriptions, locations, and sources, use simple filtering by category and country, and export limited data for personal use.
Limitations: Standard users cannot access organization-specific private incidents, use advanced analytics features, generate comprehensive reports, create security assessments, or access API endpoints.
2. Subscribed User (Individual Professional)
Access Level: Enhanced - Full Individual Access
The subscribed user role unlocks the complete power of RiskMize for individual professionals. This tier is designed for security consultants needing comprehensive intelligence, risk analysts conducting research and trend analysis, travel security managers assessing risks for travelers, and independent professionals requiring full platform capabilities.
Additional Capabilities: Complete access to all global incidents regardless of visibility settings, full dashboard functionality with all visualization options, detailed incident information including full metadata and related incidents, advanced filtering by type, location, date range, and severity, complete analytics dashboard with customizable charts and graphs, data export in all formats (CSV, JSON, PDF, Excel), security assessment tools for location-based risk evaluation, scheduled report generation and delivery, and API access for basic integration needs.
| Feature | Standard | Subscribed | Enterprise | Admin+ |
|---|---|---|---|---|
| View Global Incidents | Public only | All | All | All |
| View Organization Incidents | No | No | Yes | Yes |
| Advanced Filtering | Limited | Yes | Yes | Yes |
| Analytics Dashboard | No | Yes | Yes | Yes |
| Export Data | No | Yes | Yes | Yes |
| Security Assessments | No | Limited | Yes | Yes |
| Create Incidents | No | No | No | Editor+ |
| Manage Team | No | No | No | Ent. Admin+ |
3-8. Higher Roles
For detailed information about Enterprise User, Enterprise Admin, and other administrative roles, these build progressively on previous tiers with added team management, content creation, and financial oversight capabilities. Contact your organization administrator or our sales team to learn more about which role is appropriate for your needs.
When managing team members, always follow the principle of least privilege - grant only the access necessary for each person to perform their job functions. This reduces security risks, prevents accidental data modification, maintains audit trail clarity, and ensures regulatory compliance. Regularly review and audit user roles to ensure they remain appropriate.
Onboarding
Creating Your RiskMize Account
Your journey with RiskMize begins with account creation, a process we've designed to be quick and secure while gathering the information needed to personalize your experience. There are several paths to joining RiskMize depending on whether you're signing up as an individual, accepting an organization invitation, or starting a trial, and we'll walk through each option.
Standard Sign Up Process
If you're creating an individual account or want to explore RiskMize on your own before joining an organization, the standard sign-up process is your starting point. Begin by clicking the "Sign Up" button on the login page, which takes you to our registration form. The form is clean and straightforward, requesting only essential information to get your account established.
You'll need to provide a valid email address that will serve as your login username and primary contact method for platform communications. Choose a strong password that meets our security requirements—at least eight characters long with a mix of uppercase letters, lowercase letters, and numbers. We recommend including special characters as well for maximum security. Enter your first name and last name so we can personalize your experience and other users can identify you in collaborative features. If you're joining an existing organization or creating a new one, you can optionally enter the organization name during signup, though you can also handle organization membership later.
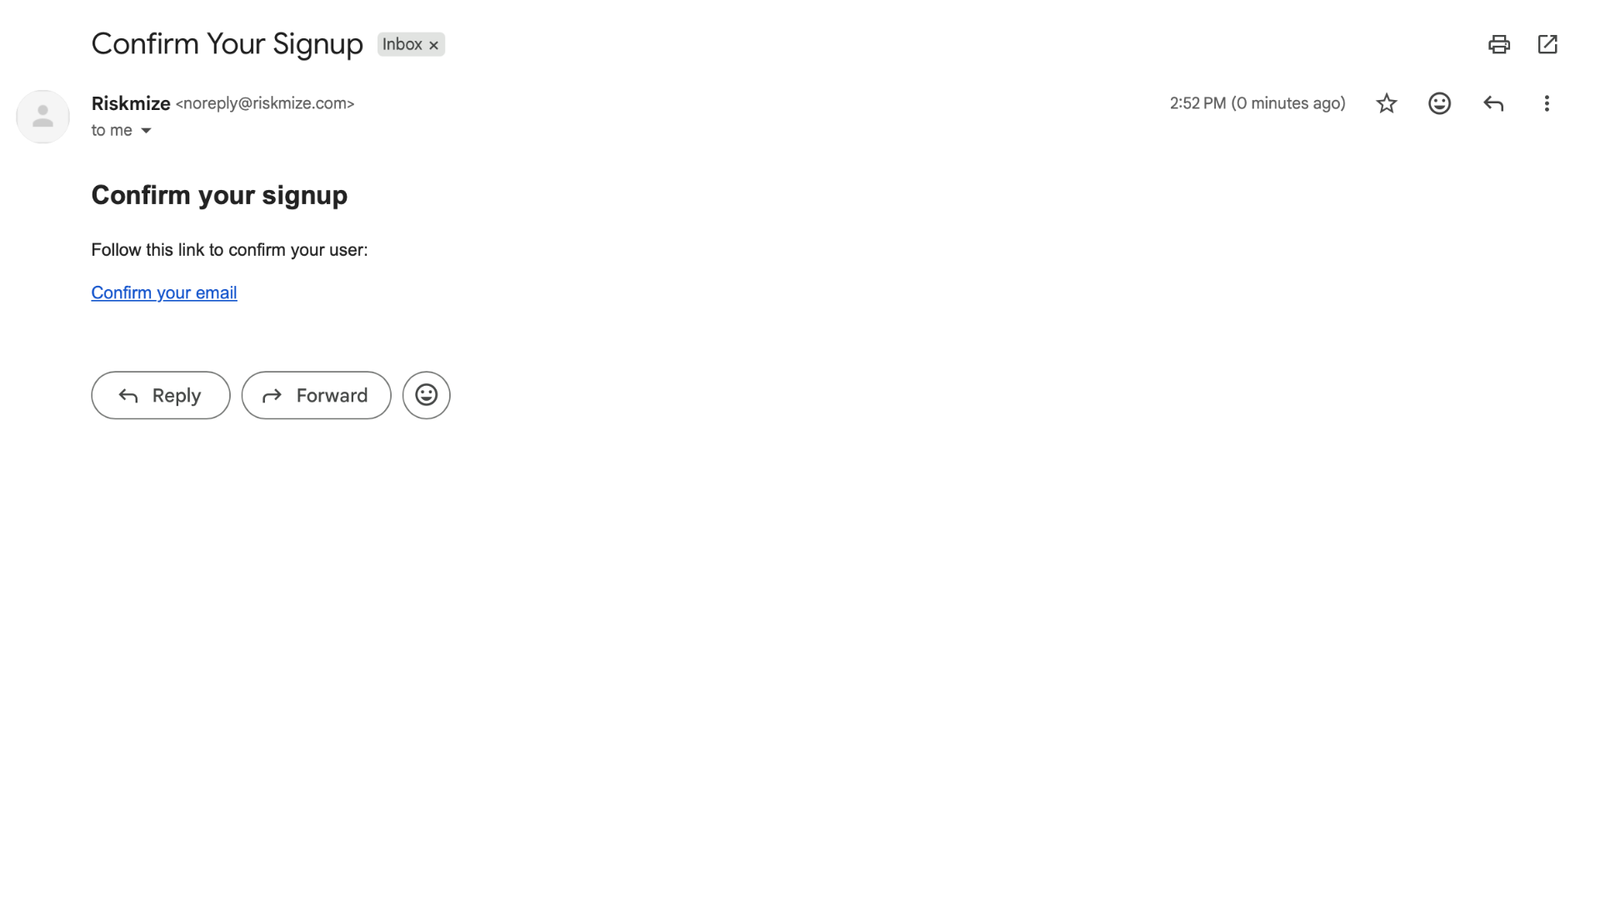
After submitting the registration form, check your email inbox for a verification message from RiskMize. This email contains a verification link that confirms your email address is valid and that you control it. Click the link in the email, and you'll be redirected to the RiskMize dashboard, fully authenticated and ready to start exploring. Don't forget to check your spam or junk folder if you don't see the verification email within a few minutes—sometimes overzealous spam filters catch legitimate messages.
Once you're logged in for the first time, take a moment to complete your profile. Navigate to your profile settings where you can add additional information like your phone number, job title, department, and location. These details help personalize your experience and make collaboration with team members more effective. You can also configure your notification preferences, time zone, and language settings to ensure RiskMize works exactly how you want it to.
Joining Through Organization Invitation
Many users join RiskMize because an organization administrator has invited them to join their team. This path is streamlined and ensures you're automatically connected to your organization from the moment your account is created. When you're invited, you'll receive an email with the subject line "Invitation to join [Organization Name] on RiskMize."
Open the invitation email and review the details about the organization you're being invited to join, the role you'll be assigned, and who sent the invitation. Click the prominent "Accept Invitation" button in the email, which takes you directly to the RiskMize platform. If you don't already have a RiskMize account, you'll be prompted to create one using the same email address that received the invitation. Follow the account creation steps, and once your account is established, you'll automatically be added to the organization.
If you already have a RiskMize account, simply log in with your existing credentials when prompted. The system will recognize your account and add you to the organization seamlessly. Your role within the organization will be assigned automatically based on what the administrator specified in the invitation. You immediately gain access to organizational features, shared incidents, team members, and any organizational resources or assessments.
Trial Account Setup
RiskMize offers generous trial periods that give you comprehensive access to platform features without requiring a credit card or payment information. This no-risk approach lets you fully evaluate whether RiskMize meets your needs before making any financial commitment.
To start a trial, look for the "Start Free Trial" option on the sign-up page. Complete the registration form with your email, password, and basic information. Your trial account is activated immediately, giving you instant access to most platform features. The trial typically lasts between fourteen and thirty days depending on current promotions and your specific situation.
During your trial, you have access to nearly all RiskMize features including the complete incident database, advanced filtering and search, interactive mapping and visualization, analytics and reporting tools, data export capabilities, and security assessment tools. The only limitations are on some enterprise collaboration features and API access, which are specifically designed for paid organizational accounts.
As your trial period progresses, you'll receive friendly email reminders at the seven-day, three-day, and one-day marks before expiration. These reminders give you plenty of time to decide whether to upgrade to a paid subscription. If you choose to upgrade before your trial expires, all your data, settings, and configurations are preserved—you simply continue using RiskMize without interruption. If your trial expires before you upgrade, your account transitions to a standard free account with limited access, but your data remains safely stored and will be restored if you later upgrade.
First Login Experience
The first time you log in to RiskMize, you're greeted with an optional interactive tour that walks you through the main features and interface elements. This tour takes just a few minutes and provides valuable context for understanding the dashboard layout, incident feed, interactive map, filtering tools, and main navigation. While you can skip the tour if you're eager to dive in, we recommend taking advantage of this guided introduction—it helps you understand where everything is and how the pieces fit together.
After completing or skipping the tour, you land on the main dashboard with a global view of recent security incidents. The dashboard may initially feel information-rich, but it's designed to be intuitive and self-explanatory. The left side displays the incident feed with recent events in chronological order. The center contains the interactive map showing incident locations. The top navigation provides access to analytics, settings, and other major features. Take a few moments to click around, try different filters, and explore incidents on the map. This hands-on exploration is the best way to become comfortable with the interface.
Don't worry about making mistakes or breaking anything—RiskMize is designed to be resilient and forgiving. Experiment with different features, try various filter combinations, and click on different interface elements to see what they do. If you ever feel lost or unsure about a feature, remember that this comprehensive documentation is always available, and our support team is ready to help if you have questions.
Dashboard
Your Command Center for Global Security Intelligence
The RiskMize dashboard is where you'll spend most of your time in the platform. It's your command center for monitoring global security incidents, analyzing trends, and accessing the tools you need to keep your organization informed and protected. We've designed the dashboard to present vast amounts of complex information in a way that's intuitive, visually appealing, and genuinely useful.
Understanding the Dashboard Layout
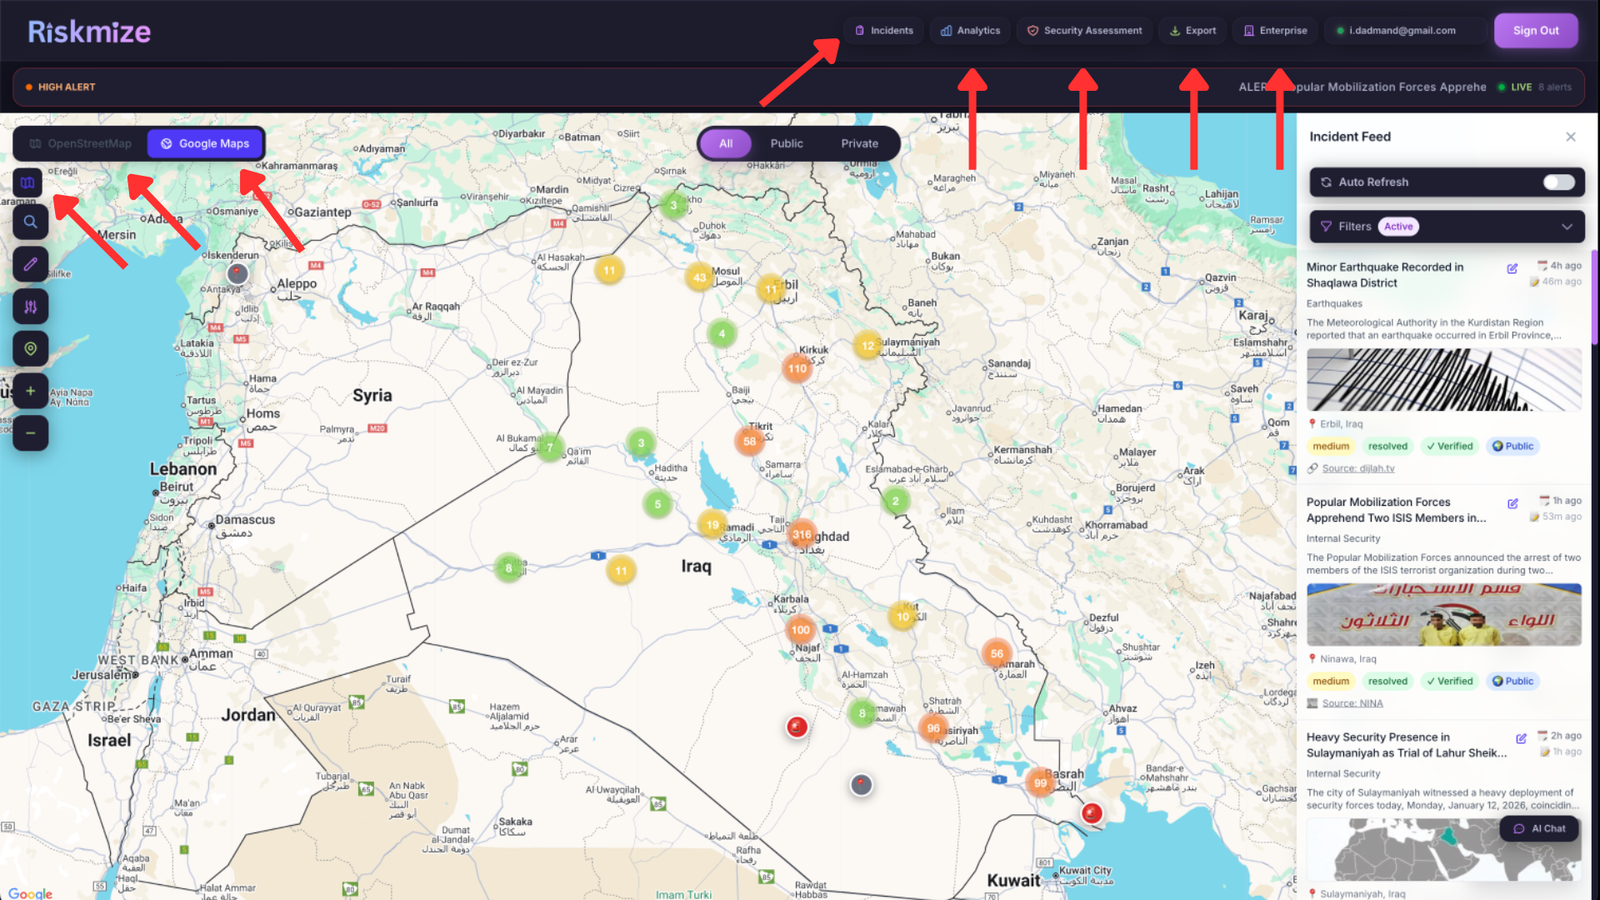
When you first see the dashboard, you'll notice it's divided into three main areas, each serving a specific purpose in your security intelligence workflow. This three-panel layout maximizes screen real estate while keeping related information organized and accessible.
The left panel is home to the incident feed, a chronologically ordered list of security incidents from around the world. This feed updates in real-time as new incidents are added to the system, ensuring you always have the latest information. Each incident in the feed appears as a compact card showing the essential details at a glance—the incident title that summarizes what happened, the date and time with automatic timezone conversion, the location including country and city, a category icon that indicates the incident type, and a severity indicator using color coding to show how serious the incident is.
The center panel is dominated by the interactive map, the visual heart of the dashboard. This beautiful, responsive map shows every incident plotted at its precise geographic location. Incidents appear as markers on the map, with different colors indicating different incident types. The map supports smooth zooming and panning, letting you focus on specific regions or pull back to see global patterns. When you click on any incident marker, a popup appears with detailed information about that incident, and clicking through takes you to the full incident details.
The right panel contains quick statistics and summary information that gives you an at-a-glance understanding of current security conditions. You'll see the total number of incidents in the past twenty-four hours, a breakdown of incidents by category showing which types of events are most prevalent, and a list of the top affected countries to help you identify geographic hotspots. These statistics update automatically as new incidents are added and as you apply different filters.
On mobile devices and tablets, this three-panel layout adapts intelligently to smaller screens. The incident feed becomes a toggleable sidebar that you can show or hide as needed. The map occupies the full screen width for optimal visibility. Statistics move to a collapsible panel that you can expand when needed. This responsive design ensures that RiskMize works beautifully whether you're at your desk on a large monitor or checking urgent updates on your phone during travel.
Working with the Incident Feed
The incident feed is your real-time window into global security events. As new incidents are reported, verified, and added to the system, they appear at the top of the feed, keeping you constantly updated on emerging situations. The feed is designed for quick scanning and easy navigation, with clear visual hierarchy and consistent formatting.
Each incident card in the feed is carefully designed to present the most important information in a scannable format. The title appears prominently at the top in bold text, giving you an immediate understanding of what happened. Below the title, you see a brief description or excerpt that provides crucial context without overwhelming you with details. The date and time appear in your local timezone, so you always know when an incident occurred relative to your current time. The location is clearly marked with country and city information, and a small flag icon helps you quickly identify the geographic region. A colored category badge indicates whether the incident is terrorism, crime, political unrest, a natural disaster, health emergency, cyber attack, or another type of event.
Scrolling through the feed is smooth and responsive, with infinite scrolling that automatically loads more incidents as you reach the bottom. You never have to click through pages or wait for new content to load—the experience is seamless and natural. If you see an incident that interests you, simply click anywhere on the card to open the detailed view where you can read the full description, see all available metadata, view related incidents, and take actions like exporting or sharing.
Filtering and Searching for Relevant Incidents
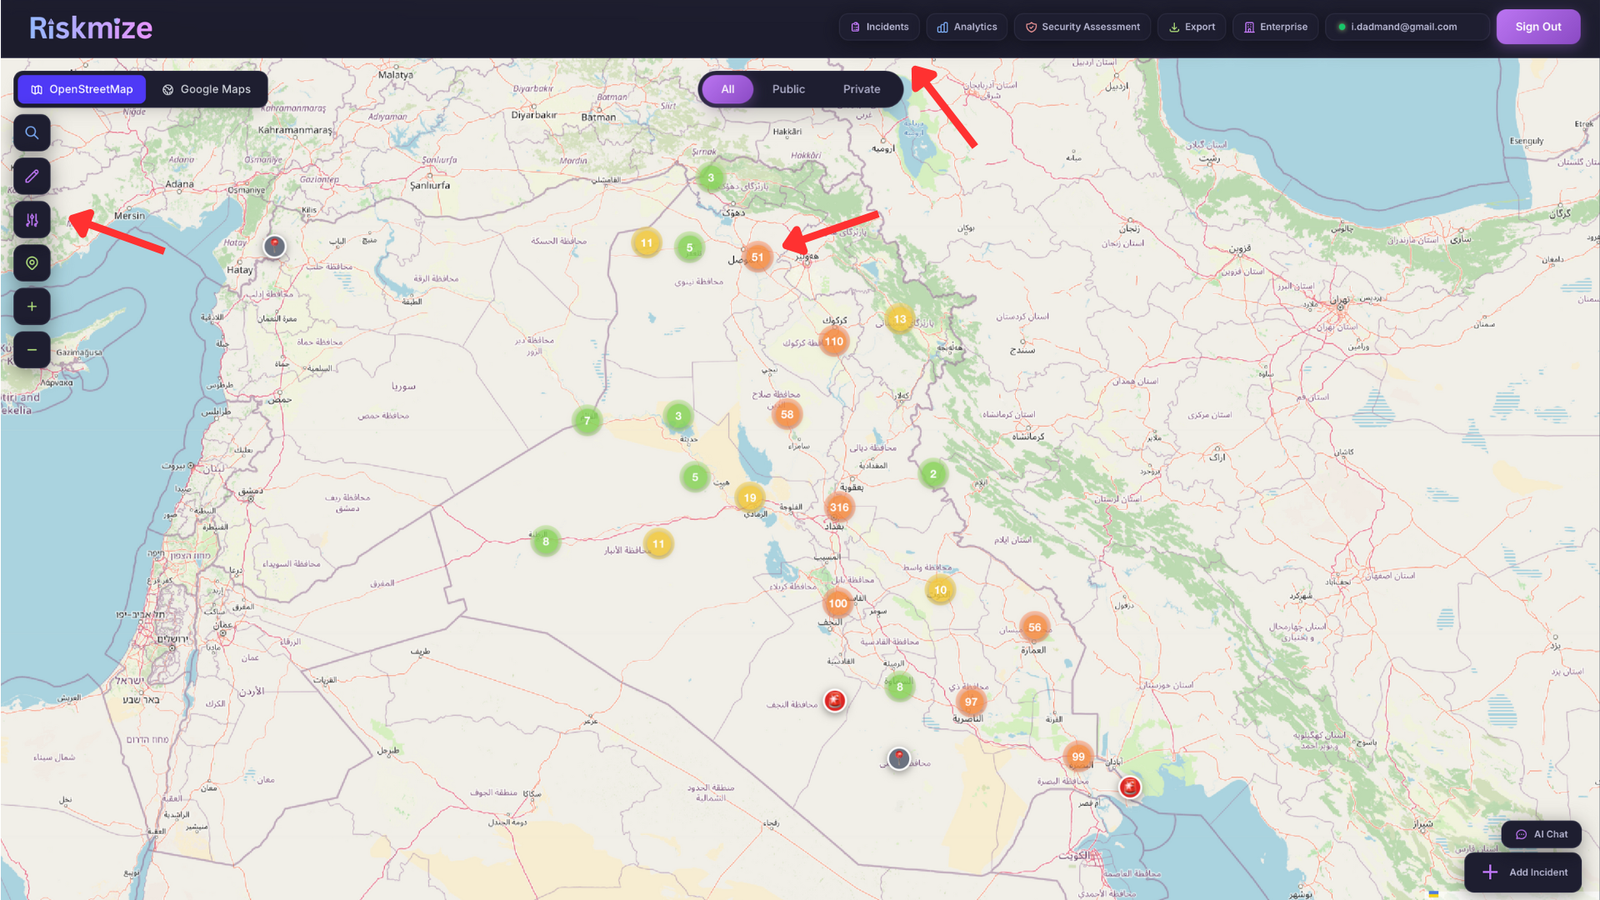
With thousands of incidents from around the world, finding the specific information you need could be challenging without powerful filtering tools. RiskMize's intelligent filtering system makes it effortless to narrow down the incident database to exactly what matters to you.
At the top of the incident feed, you'll find a row of filter buttons that let you quickly select which types of incidents you want to view. The "All" button shows every incident you have permission to see, providing a comprehensive view of global security events. The "Public" button filters to show only publicly visible incidents that have been verified and are available to all users. For enterprise users, the "Organization" button shows private incidents specific to your organization that aren't visible to the general public.
Below the type filters, you'll find category filters that let you focus on specific types of incidents. Click "Terrorism" to see only terrorist activities and threats. Select "Crime" to filter for criminal incidents. Choose "Political Unrest" to monitor protests, riots, and political violence. Pick "Natural Disasters" for earthquakes, floods, hurricanes, and other environmental events. Select "Health Emergencies" for disease outbreaks and pandemics. Click "Cyber Attacks" to focus on digital security incidents. You can select multiple categories simultaneously, and the feed updates instantly to show only incidents matching your selection.
The country filter dropdown lets you narrow incidents to specific geographic regions. Open the dropdown to see an alphabetical list of all countries with reported incidents. Select one or multiple countries to focus on those regions. The incident count next to each country name shows how many incidents are currently visible for that location. Clear the filter anytime to return to the global view.
Date range filtering helps you analyze specific time periods or focus on recent events. Click the date range selector to choose a start and end date. The system will instantly filter to show only incidents that occurred within your selected timeframe. This is particularly useful for historical analysis, comparing different time periods, or generating time-specific reports.
Severity filtering lets you prioritize based on how serious incidents are. Low severity incidents are minor events with limited impact. Medium severity represents moderate incidents with localized impact. High severity indicates major incidents with significant impact. Critical severity marks severe incidents with widespread impact. Click any severity level to filter, or select multiple levels to see a range of incident severities.
All these filters work together, so you can create highly specific views like "high and critical terrorism incidents in the Middle East from the past thirty days" or "all natural disasters in Southeast Asia this year." The system processes your filter combinations instantly, updating both the incident feed and the map in real-time. Your filter selections are remembered during your session, so you can navigate away and return without losing your configured view.
Mastering the Interactive Map
The interactive map is one of RiskMize's most powerful features, transforming raw incident data into visual intelligence that reveals patterns, hotspots, and geographic trends that would be invisible in a simple list. The map is built on modern mapping technology that provides smooth performance even with thousands of incidents displayed simultaneously.
Navigating the map is intuitive whether you're using a mouse, trackpad, or touchscreen. On desktop, use your mouse wheel to zoom in and out smoothly. Click and drag to pan across different regions. On mobile and tablets, use standard pinch-to-zoom gestures and single-finger dragging to navigate. The map responds instantly to your input with smooth animations and fast rendering.
Incident markers on the map are color-coded by category, making it easy to see at a glance what types of events are occurring in different regions. Red markers typically indicate violent incidents like terrorism or crime. Orange markers show political unrest and protests. Blue markers represent cyber attacks. Green markers indicate health emergencies. Brown markers show natural disasters. This visual encoding lets you quickly scan the map and identify areas experiencing particular types of security challenges.
When incidents are close together geographically, the map automatically clusters them to prevent visual clutter. These cluster markers show a number indicating how many incidents they contain. As you zoom in, clusters automatically break apart to reveal individual incidents. This intelligent clustering ensures the map remains readable and performant even in regions with high incident density like major metropolitan areas.
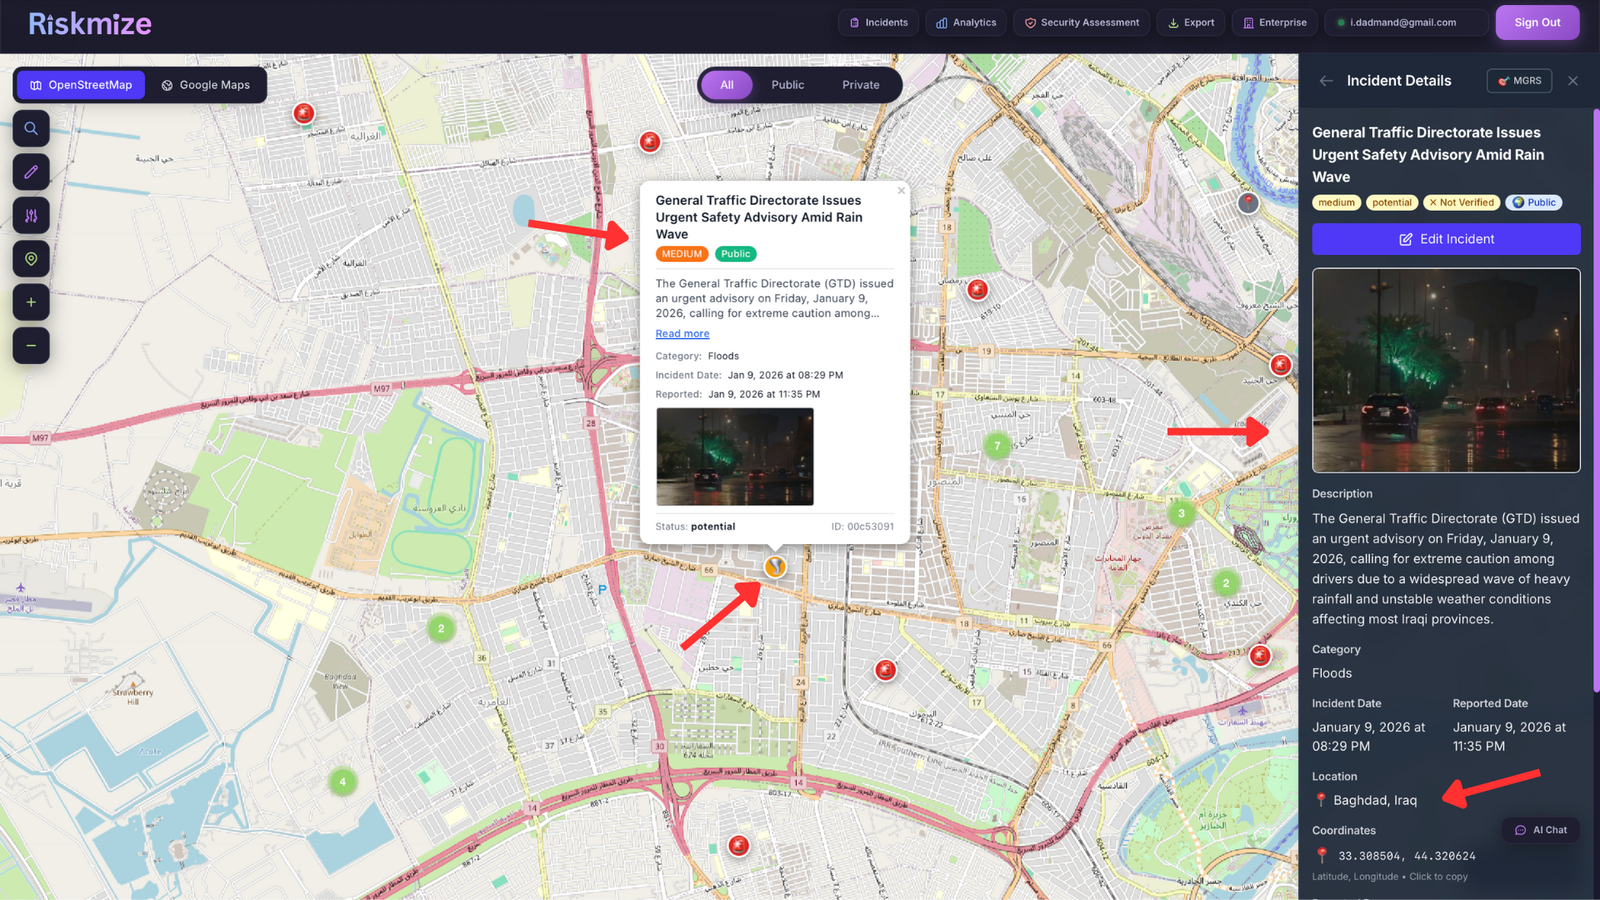
Clicking any incident marker opens a popup showing key details about that incident. The popup includes the title, date, location, category, and a brief description. From the popup, you can click through to view the full incident details, which opens a comprehensive panel with all available information, related incidents, source attribution, and action buttons for sharing or exporting.
The map controls in the corner provide quick access to common functions. The plus and minus buttons let you zoom in and out with precise control. The "Fit All" button automatically adjusts the map to show all currently visible incidents, perfect for getting an overview after applying filters. The layer control lets you switch between different map styles—street view for urban context, satellite imagery for geographic reference, or terrain view for topographic information.
A search box at the top of the map lets you quickly jump to specific locations. Type a city name, address, or even coordinates, and the map will find and navigate to that location. This is incredibly useful when you need to check incident activity around a specific site, plan travel to a particular destination, or respond to questions about security conditions in a specific area.
Dashboard Features and Capabilities by Role
What you can do in the dashboard depends on your user role and the permissions associated with that role. Standard free users have access to basic dashboard functionality including viewing public global incidents, using the map with basic zoom and pan, applying simple filters by category and country, and viewing incident details. This provides genuine value for personal situational awareness even without a paid subscription.
Subscribed users unlock the full dashboard experience with access to all global incidents regardless of visibility, complete map tools including all layer types and advanced controls, advanced filtering with all options including date ranges and severity, detailed incident information with full metadata and source links, and the ability to export filtered incident data. These capabilities transform the dashboard from a monitoring tool into a comprehensive intelligence platform.
Enterprise users get everything subscribed users have plus access to organizational incidents that provide insight into organization-specific security intelligence, shared security assessments created by team members, organizational filters that let you focus on incidents relevant to your organization's operations, and collaborative features that enable team-based analysis and response.
Enterprise admins and higher roles gain access to incident management features directly from the dashboard, including the ability to create new incidents, edit existing incidents, moderate user-submitted content, and access administrative controls. These content management capabilities are seamlessly integrated into the dashboard interface so authorized users can maintain and update the incident database without leaving their primary workspace.
Customizing Your Dashboard Experience
RiskMize remembers your preferences and configurations so your dashboard looks and works the way you want it to. The filters you select persist across sessions, so you don't have to reconfigure your view every time you log in. Your map position and zoom level are saved, returning you to the exact view you were using when you last visited. Display preferences like incident card density, map style, and panel sizes are all preserved.
If you work with multiple different views for different purposes, you can quickly switch between them using saved filter configurations. For example, you might have a "Daily Briefing" view that shows all incidents from the past twenty-four hours, a "Travel Security" view focused on specific countries where your organization operates, a "Cyber Threat" view filtered to show only cyber attacks and technology-related incidents, and a "Crisis Response" view that displays only high and critical severity incidents. While the platform doesn't currently support named saved views, your browser history and bookmarks can serve this purpose by saving specific URLs with filter parameters.
Incident Management
Comprehensive Incident Intelligence
Incident management in RiskMize goes beyond simply viewing security events. For users with appropriate permissions, the platform provides comprehensive tools for creating, editing, categorizing, and distributing incident intelligence. Whether you're consuming incident information to stay informed or producing incident reports to inform others, RiskMize provides the capabilities you need.
Viewing and Exploring Incidents
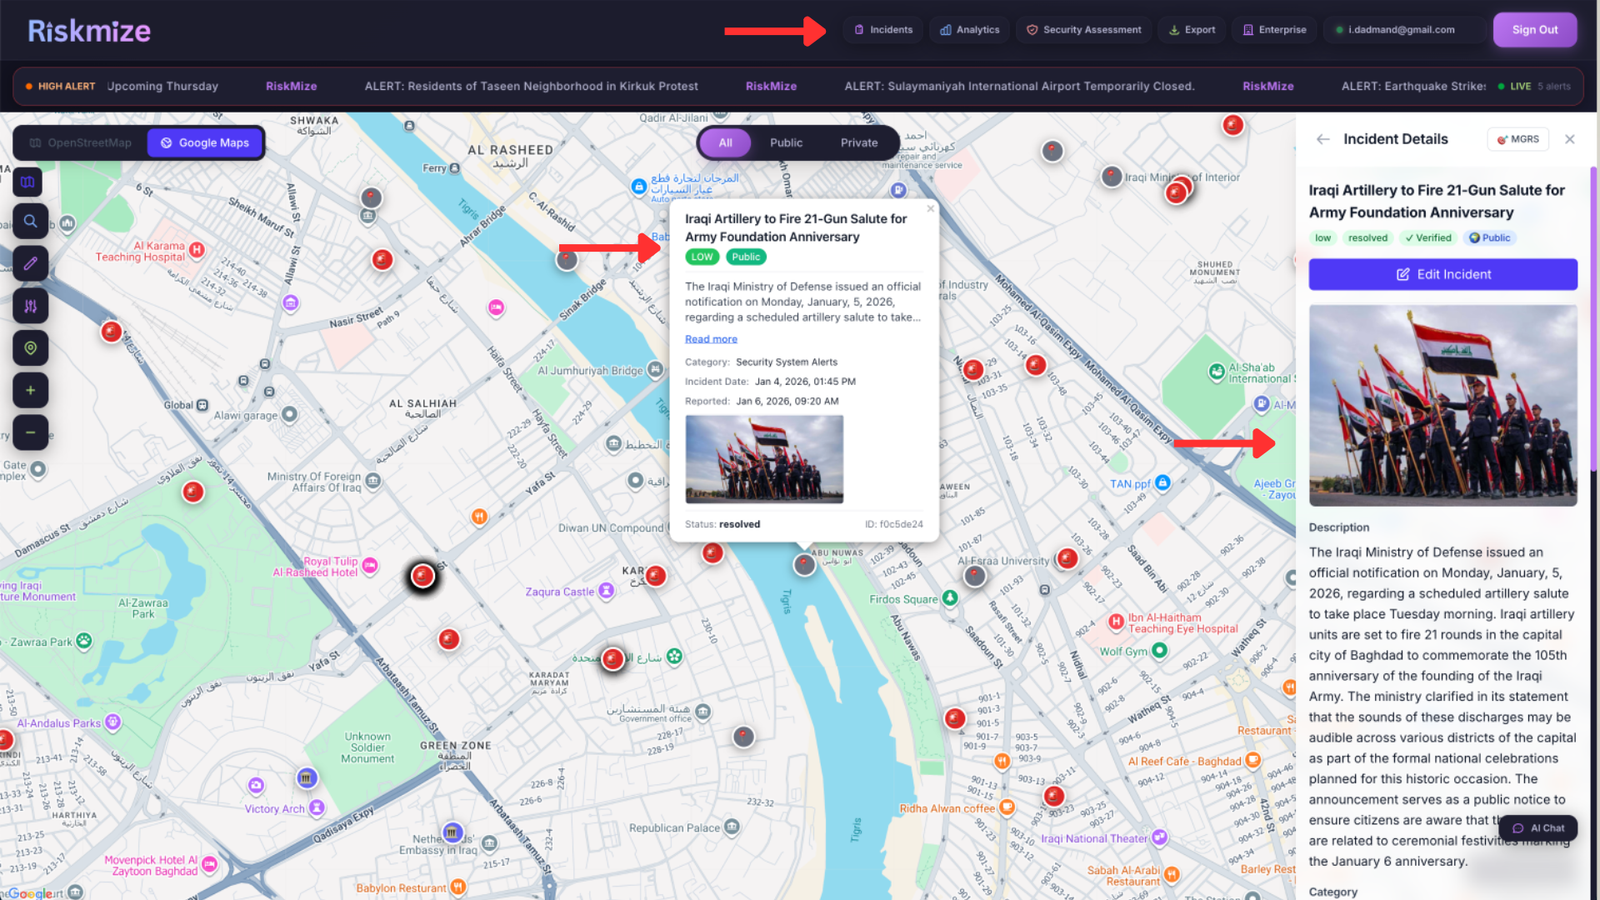
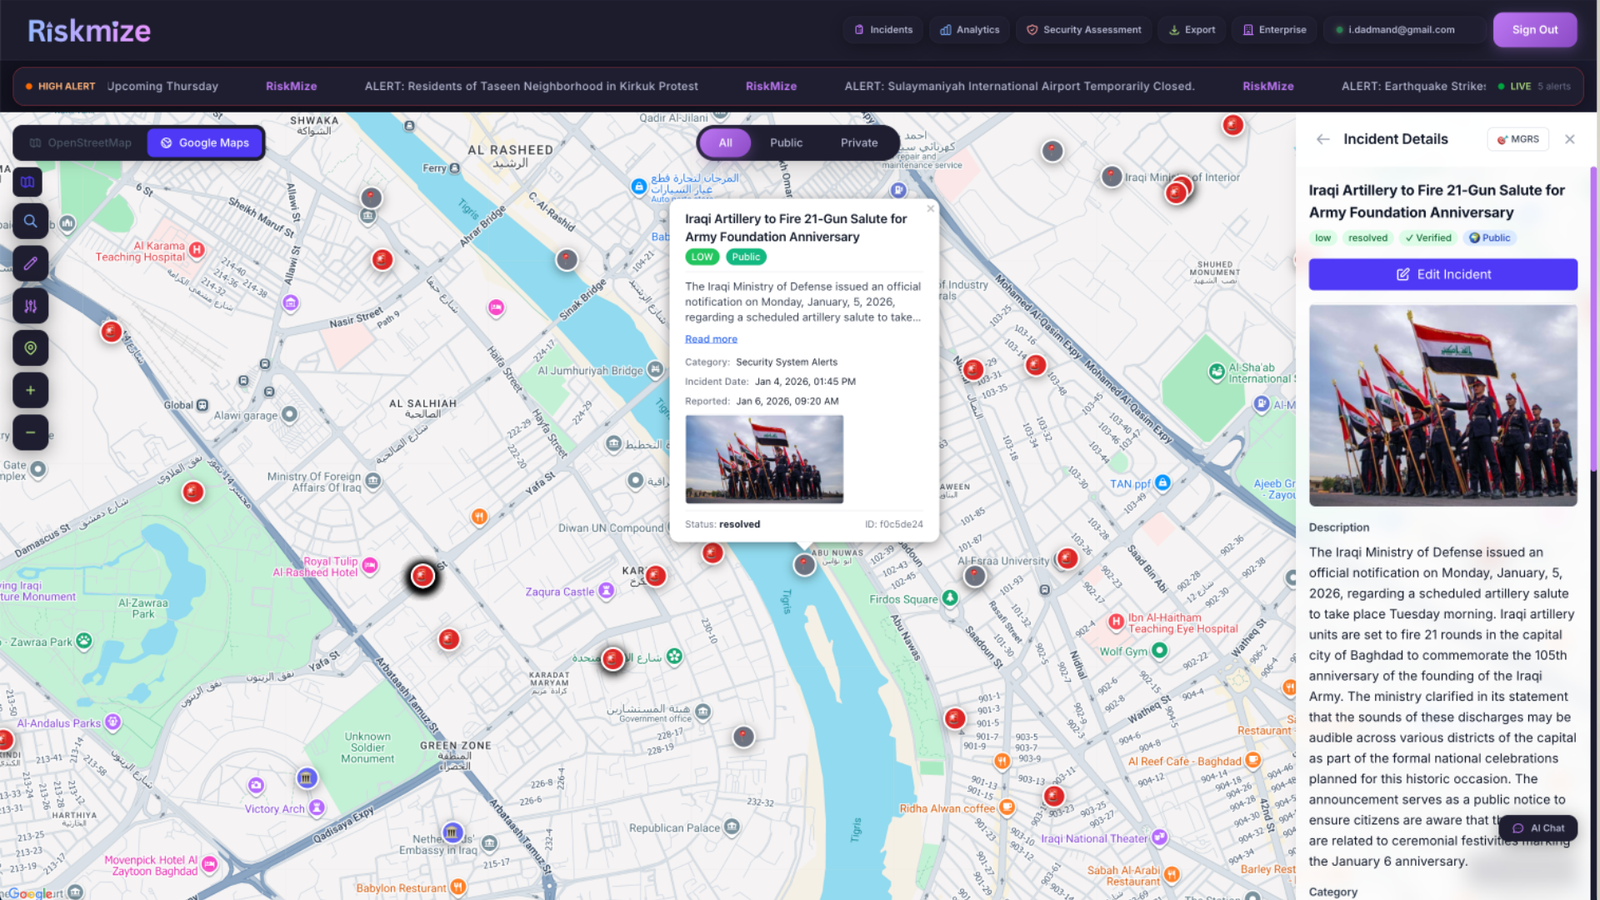
Every incident in RiskMize is a structured record containing detailed information about a security event. When you view an incident, you're seeing the result of careful categorization, verification, and metadata enrichment that transforms a raw event report into actionable intelligence.
Opening an incident from the feed or map takes you to the detailed incident view, a comprehensive panel that presents all available information about the event in a clear, organized format. At the top, you see the incident header containing the full title, the precise date and time with timezone, the exact location with country, city, and coordinates, and the severity assessment. The main content area displays the complete incident description, which may include what happened, who was involved, how the situation unfolded, current status, and implications or analysis.
Below the description, you find the incident metadata section with categorization information showing the incident type and any subcategories, severity level with color-coded indicator, source attribution with links to original reports or news articles, affected population estimates if available, geographic coordinates for precise mapping, and status information indicating whether the incident is ongoing, resolved, or under investigation.
Related incidents appear in a separate section, showing other events that are geographically nearby, similar in nature, related chronologically, or connected to the same broader situation. This contextual linking helps you understand incidents as part of larger patterns rather than isolated events.
For incidents visible to your organization, you may see additional collaborative features including comments and discussions from team members, assessment notes added by security analysts, links to related security assessments, and action items or follow-ups. These collaborative elements transform individual incidents into focal points for team analysis and decision-making.
Creating New Incidents (Editor and Admin Roles)
Users with editor or administrative roles have the authority to create new incidents in the RiskMize database. This capability comes with significant responsibility, as the incidents you create become part of the global intelligence picture used by organizations and professionals worldwide for security decision-making.
To create an incident, navigate to the admin panel and select the incidents section. Click the "Create New Incident" button to open the incident creation form. This form guides you through capturing all necessary information to create a comprehensive, useful incident record.
Start with the basic information section where you enter a clear, concise title that summarizes what happened—think of how a news headline would describe the event. The title should be descriptive enough that users can understand the incident at a glance without reading the full details. Write a detailed description in the next field, providing comprehensive information about what occurred, when and where it happened, who was involved, what the current status is, and what the implications might be. Good descriptions provide context and detail without speculation or editorializing.
Select the appropriate category from the dropdown menu. Categories help users filter and find incidents relevant to their interests. Choose terrorism for terrorist attacks, threats, or related activities; crime for criminal incidents including robberies, assaults, kidnappings, and other violations; political unrest for protests, riots, demonstrations, coups, and political violence; natural disasters for earthquakes, floods, hurricanes, tsunamis, and environmental events; health emergencies for disease outbreaks, pandemics, and public health crises; cyber attacks for digital security incidents, data breaches, and technology-related threats; or other for incidents that don't fit cleanly into standard categories.
The location section requires careful attention because accurate geographic data ensures incidents appear correctly on the map and can be found through location-based searches and filters. Select the country from the comprehensive dropdown list. Enter the specific city or region where the incident occurred. If you know the precise coordinates, you can enter the latitude and longitude directly. If not, the system can often derive coordinates from the city name you provided. Specify the affected area radius in kilometers to indicate how widely the impact extends beyond the central point.
Incident details include temporal and severity information. Set the date and time when the incident occurred, being as precise as possible. Select the severity level based on the impact and seriousness of the event—low for minor incidents with limited impact, medium for moderate incidents with localized effects, high for major incidents with significant impact, or critical for severe incidents with widespread consequences. If you're documenting the incident from a news source or report, include the source URL so users can read the original material for additional context. If there were casualties, document the number if known. Set the current status to ongoing if the situation is still active, resolved if it has concluded, or under investigation if details are still emerging.
The visibility setting determines who can see the incident you're creating. Public incidents are visible to all RiskMize users and appear in the global incident feed. Organization-only incidents are visible only to members of your organization, useful for documenting organization-specific security concerns. Private incidents are visible only to administrators, suitable for sensitive information that requires restricted access.
After entering all information, review your incident details carefully. Check for accuracy, completeness, clarity, and proper categorization. When you're satisfied, click "Create Incident" to publish. The incident is immediately added to the database and becomes visible to users according to its visibility setting. It appears in the incident feed, shows up on the map at its specified location, becomes searchable and filterable, and integrates into analytics and reporting.
Editing and Updating Incidents
Incidents often require updates as situations evolve, additional information emerges, or errors are discovered. Editors and administrators can modify any incident to ensure the database remains accurate and current.
To edit an incident, locate it either through the admin panel incident list or by clicking on it in the main dashboard and selecting the edit option. The edit form is identical to the creation form but pre-populated with the existing incident data. Make whatever changes are necessary to correct errors, add new information, update status, adjust severity, or refine categorization. When you save changes, the incident is immediately updated throughout the system, and if your organization uses audit logging, your modifications are tracked for accountability.
Deleting Incidents
Sometimes incidents need to be removed from the database entirely—perhaps because they were duplicates, contained incorrect information that couldn't be corrected, violated content policies, or were created in error. Administrators have the authority to permanently delete incidents.
To delete an incident, navigate to it in the admin panel, open the action menu (usually a three-dot icon), and select "Delete." The system will ask you to confirm the deletion because this action is permanent and cannot be undone. Once confirmed, the incident is completely removed from the database, disappears from all user interfaces, is removed from analytics and reports, and cannot be recovered. For this reason, deletion should be used sparingly and only when absolutely necessary.
Importing Incidents from News Sources
RiskMize includes powerful tools for automatically identifying potential security incidents from news sources and RSS feeds. This automation helps keep the incident database current and comprehensive without requiring manual searching and entry for every event.
The news import tool is accessed through the admin panel under "News Import." Here you can configure RSS feeds from trusted news sources, specify keywords and patterns that indicate potential security incidents, set filtering rules to reduce false positives, and define auto-categorization rules that assign incident types based on content. The system continuously monitors configured feeds, identifies articles matching your criteria, extracts relevant information, and adds potential incidents to a review queue.
The review queue presents identified incidents for human verification before they're published to the database. Each potential incident shows the extracted title and description, suggested category and location, source article with link, confidence score indicating how well it matches incident criteria, and preview of how it will appear if approved. You can review each incident individually, editing information as needed, correcting any extraction errors, verifying the incident is legitimate and relevant, and either approving it for publication or rejecting it as irrelevant.
For high-confidence incidents from trusted sources, you can configure automatic approval rules that publish certain types of incidents without manual review, though human oversight is recommended for maintaining quality and accuracy.
Analytics
Transforming Data into Intelligence
The RiskMize analytics platform transforms thousands of individual incidents into meaningful insights about security trends, patterns, and risks. Whether you're preparing briefings for executive leadership, conducting research for academic purposes, identifying emerging threat patterns, or planning security measures for international operations, our analytics tools provide the depth and flexibility you need.
Accessing the Analytics Dashboard
The analytics dashboard is accessible from the main navigation menu. Click "Analytics" in the header or select it from the mobile menu to access a comprehensive analytical environment built around visualizations, statistics, and reporting tools. The analytics dashboard is available to subscribed users, enterprise users, and all administrative roles. Standard free users have limited access to basic statistics.
When you first open the analytics dashboard, you're presented with an overview page showing high-level statistics and key visualizations. From here, you can drill down into specific analyses, apply filters to focus on particular aspects of the data, generate custom reports, and export analytical results for use in presentations or further analysis.
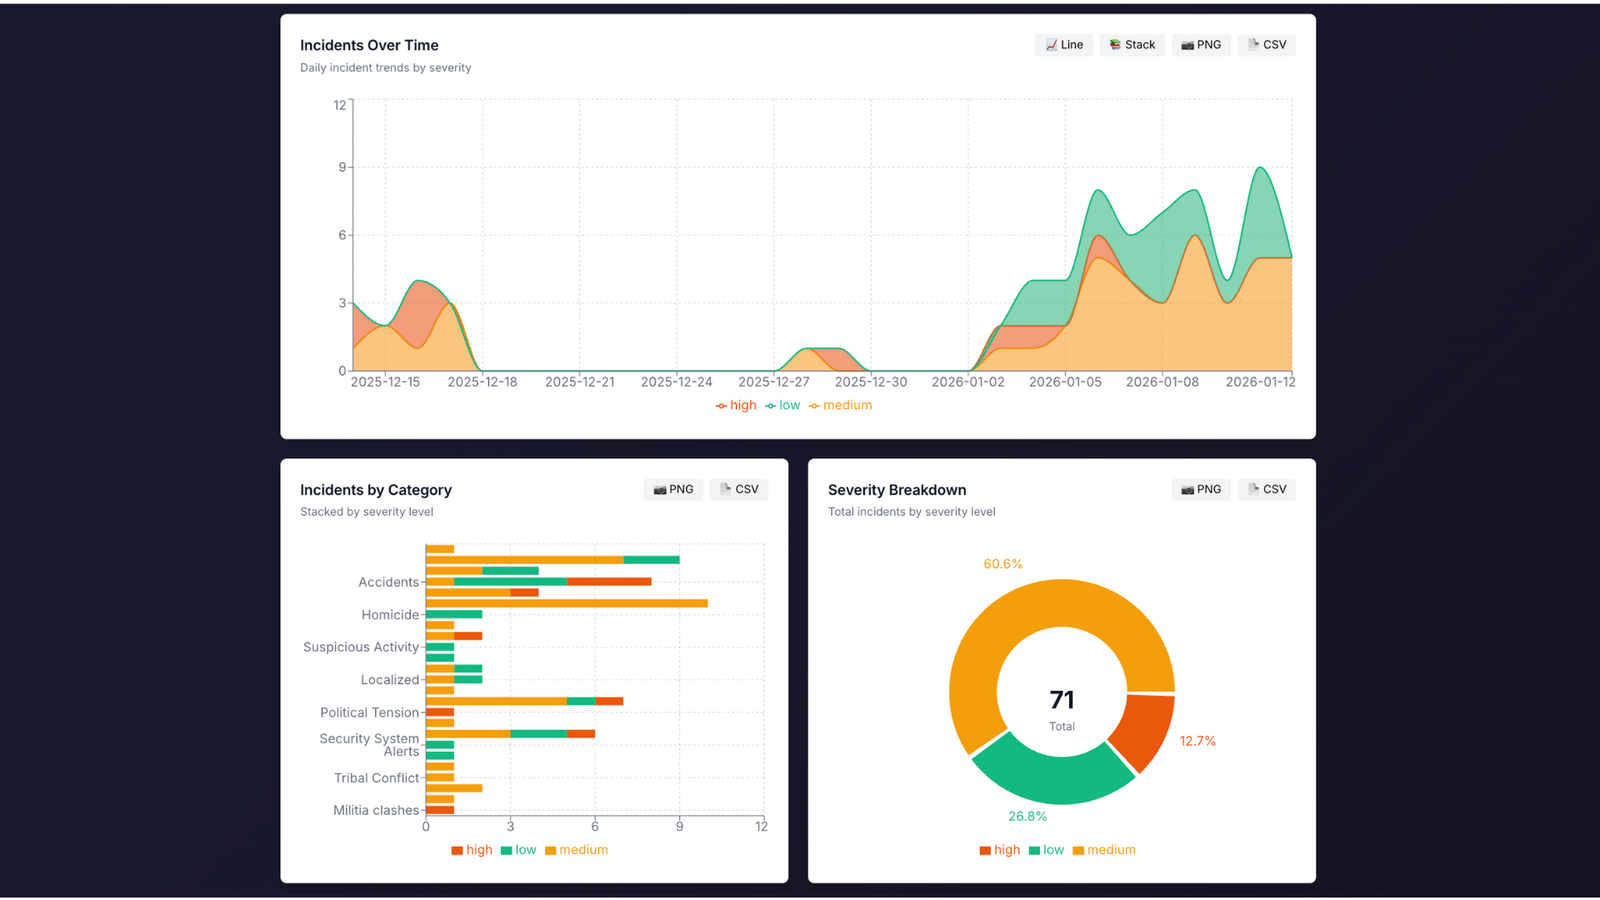
Core Analytical Visualizations
The analytics dashboard includes several pre-built visualizations that address common analytical needs. The incident timeline is a powerful graph showing incident frequency over time. You can view this data by day, week, month, or year to identify temporal patterns. The timeline clearly shows whether incident frequency is increasing, decreasing, or remaining stable, reveals seasonal patterns or cyclical trends, highlights spikes that might indicate crises or major events, and enables comparison between different time periods.
The category breakdown presents a pie chart or bar graph showing the distribution of incidents across different types. This visualization instantly reveals which types of security events are most prevalent, helps identify whether your area of interest is dominated by particular threat types, shows the relative proportion of different incident categories, and enables comparison between different geographic regions or time periods.
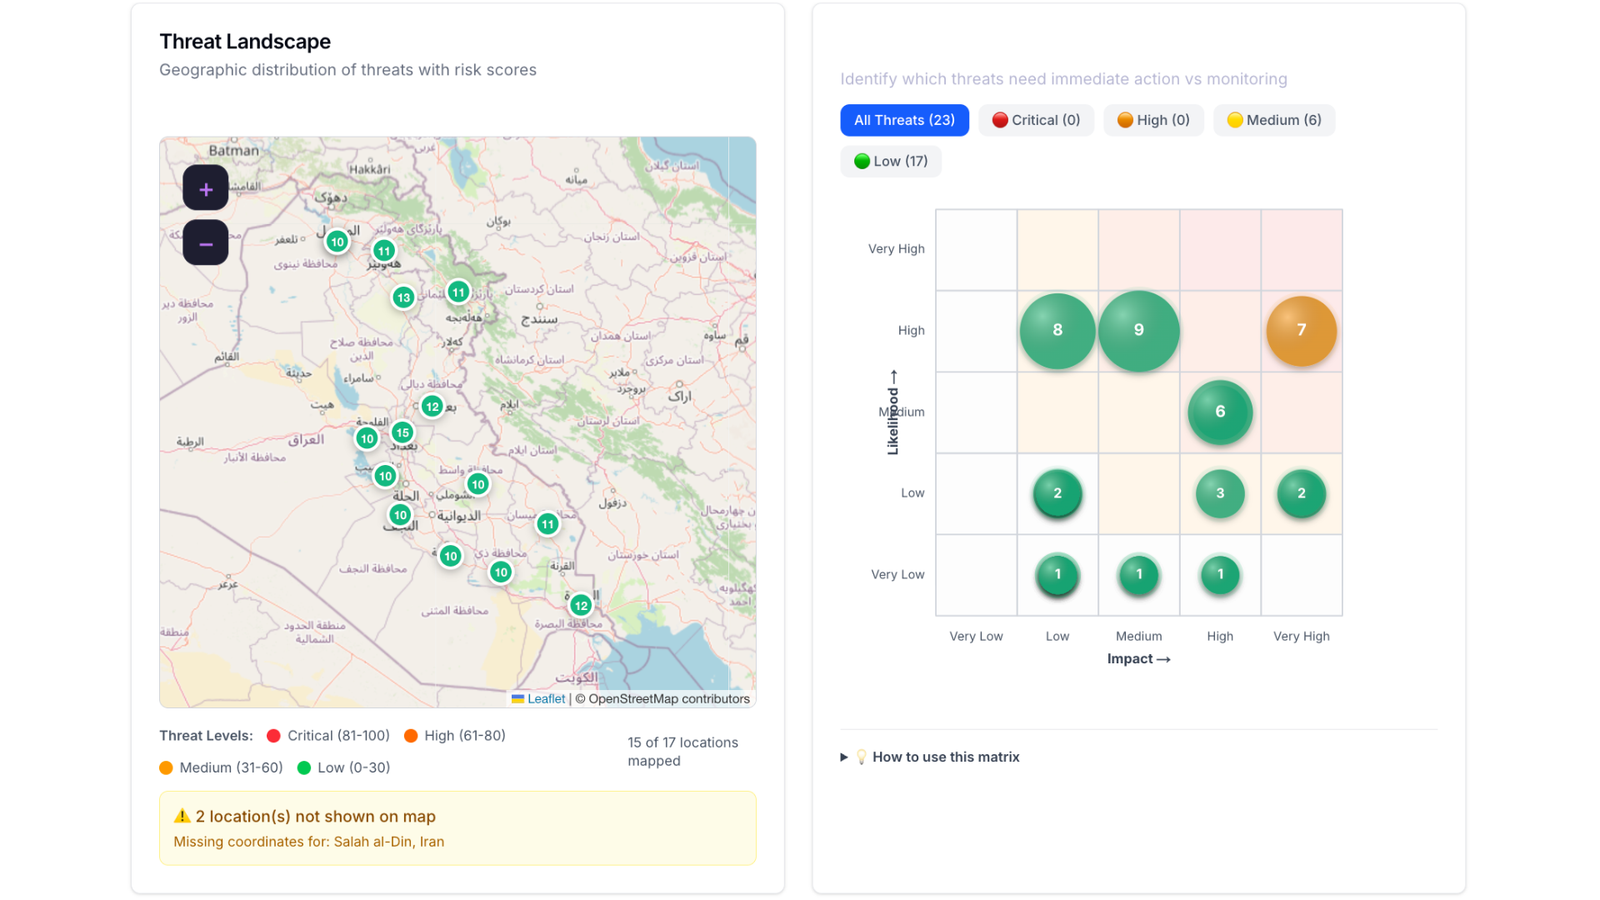
The geographic distribution visualization uses a world map with color-coded intensity to show incident density across different countries and regions. This heatmap reveals which areas are experiencing the highest incident rates, identifies emerging hotspots that might require additional attention, compares regional security conditions, and tracks how geographic patterns change over time.
Severity analysis shows the distribution of incidents across severity levels, helping you understand not just how many incidents are occurring but how serious they are. This visualization highlights whether incidents in a region are generally minor or predominantly serious, tracks whether severity levels are increasing or decreasing over time, and identifies regions where critical incidents are concentrated.
Advanced Analytical Capabilities
Beyond the standard visualizations, RiskMize provides sophisticated analytical tools for deeper investigation. Trend analysis uses statistical methods to identify whether incident frequency or severity is trending upward or downward over time. The system can detect subtle trends that might not be obvious from visual inspection alone, calculate trend lines and confidence intervals, identify accelerating or decelerating trends, and alert you to statistically significant changes.
Comparative analysis lets you compare different geographic regions, time periods, incident categories, or severity levels side by side. You might compare incident rates between two countries to evaluate relative security conditions, contrast this year's incident patterns with last year's to identify changes, analyze how different regions respond to similar threat types, or evaluate whether security conditions are improving or deteriorating over time.
Correlation analysis helps identify relationships between different variables. While correlation doesn't prove causation, it can reveal interesting patterns worth investigating further. The system can identify whether certain types of incidents tend to occur together, show whether incidents in one region correlate with incidents in another, reveal seasonal or cyclical patterns, and suggest factors that might influence incident rates.
Generating Reports
Reports are one of the most valuable outputs of the analytics system. RiskMize offers both quick reports for immediate needs and scheduled reports for regular distribution to stakeholders.
To generate a quick report, start by navigating to the analytics dashboard and applying whatever filters you want to focus the report on a specific geographic region, time period, incident type, or severity level. Configure the report parameters including the report type (incident summary, geographic analysis, trend report, or custom report), date range, level of detail, and which visualizations to include. Click "Generate Report" and the system will compile the report in real-time, typically taking just a few seconds. You can then view the report in your browser or download it in your preferred format.
Report formats include PDF for professional-looking documents suitable for printing or emailing to stakeholders, Excel spreadsheets with multiple sheets for raw data, summary statistics, and embedded charts, CSV files containing raw data for import into other analytical tools, and JSON for programmatic access or integration with other systems.
Scheduled Reports for Stakeholders
For organizations that need regular security briefings, scheduled reports automate the process of generating and distributing analytical reports. Enterprise users and administrators can create report schedules that automatically generate and email reports on a regular basis.
To set up a scheduled report, access the report scheduler from the analytics dashboard. Click "Create Schedule" to configure a new scheduled report. Give the report a descriptive name like "Weekly Security Briefing" or "Monthly Incident Summary." Set the frequency to daily, weekly, or monthly depending on your needs. Specify the day and time when the report should be generated and sent. Enter the email addresses of recipients who should receive the report—you can specify multiple addresses separated by commas.
Configure the report content by selecting the report type, defining filters for geographic region, incident categories, severity levels, or other criteria, choosing which visualizations and statistics to include, and selecting the export format (usually PDF for email distribution). Save the schedule and the system will automatically generate and distribute reports according to your configuration.
Scheduled reports are particularly valuable for keeping non-technical stakeholders informed without requiring them to log into the platform or understand how to generate reports themselves. Security managers often create multiple scheduled reports for different audiences—a daily critical incident alert for the security team, a weekly summary for department heads, and a monthly comprehensive report for executive leadership.
Exporting Analytical Data
Any analytical view or report can be exported for use outside RiskMize. The export function preserves your filters, date ranges, and selections so the exported data matches exactly what you're seeing on screen. Exports can include raw incident data from your filtered view, calculated statistics and aggregations, charts and visualizations as images, and complete formatted reports with all elements.
The analytics export is separate from the main incident export function and is specifically designed for analytical outputs rather than raw incident lists. Use this when you need to incorporate RiskMize analytics into PowerPoint presentations, create custom visualizations in Excel or other tools, perform additional statistical analysis in specialized software, or share analytical results with people who don't have RiskMize access.
Security Assessment
Evaluating Risk with Confidence
Security assessments are one of RiskMize's most powerful capabilities, transforming historical incident data and current intelligence into actionable risk evaluations for specific locations. Whether you're evaluating the safety of a travel destination, assessing the security of a potential office location, planning security measures for an international event, or conducting due diligence on international partnerships, our security assessment tools provide data-driven insights that inform better decisions.
Understanding Security Assessments
A security assessment in RiskMize is a comprehensive evaluation of security risks for a specific location and time period. The assessment engine analyzes historical incident patterns in the area, examines current incident activity, evaluates the types of threats present, assesses the severity and frequency of incidents, compares conditions to regional and global averages, and generates an overall risk score and detailed recommendations.
Unlike generic travel advisories that cover entire countries, RiskMize assessments can be focused on specific cities, neighborhoods, or even precise addresses. This granular approach recognizes that security conditions often vary dramatically within a single country or even a single city. An assessment for a secured business district may differ significantly from one for a high-risk neighborhood just a few kilometers away.
Creating a Security Assessment
Security assessments are available to enterprise users, enterprise administrators, super administrators, and sultan administrators. To create an assessment, navigate to the Security Assessment section from the main menu. Click "New Assessment" to open the assessment creation form.
Begin by defining the location you want to assess. Select the country from the dropdown, then enter the specific city or region. If you're assessing a precise location like a hotel, office building, or event venue, you can enter the full address or coordinates for maximum precision. The system will use this location as the center point for analysis. Specify the assessment radius, which determines how large an area around the center point will be included in the analysis. A radius of five to ten kilometers is appropriate for evaluating a specific site, twenty to fifty kilometers works for city-level assessments, and larger radii can evaluate regional security conditions.
Choose the assessment type that best matches your use case. Travel security assessments focus on risks relevant to travelers like crime, terrorism, political unrest, and transportation safety. Site security assessments emphasize risks to fixed facilities including crime, proximity to previous incidents, protest activity, and regional stability. Event security assessments consider risks specific to public gatherings like protest likelihood, terrorism threats, crowd control issues, and emergency response capacity. General assessments provide a broad evaluation suitable for most purposes.
Define the time frame for the assessment by setting start and end dates. This typically represents when you'll be traveling to the location, when you're considering establishing operations there, or when you're planning an event. The assessment engine will evaluate current conditions and use historical data to identify patterns that might affect your time frame.
Click "Generate Assessment" and the system begins analyzing relevant data. For most assessments, this takes ten to thirty seconds. The engine examines incident history for the specified location and radius, analyzes frequency and types of incidents, evaluates severity trends over time, compares to regional and global patterns, assesses current threat levels, and generates risk scoring and recommendations.
Understanding Assessment Results
When the assessment is complete, you see a comprehensive report with multiple sections. The risk score is a numerical value from zero to one hundred that summarizes the overall security risk level. Zero to twenty-five indicates low risk represented by green color coding—this is a relatively safe environment with few security concerns. Twenty-six to fifty indicates moderate risk shown in yellow—some security concerns exist but can generally be managed with standard precautions. Fifty-one to seventy-five indicates high risk shown in orange—significant security concerns exist requiring serious risk mitigation measures. Seventy-six to one hundred indicates critical risk shown in red—severe security concerns that may warrant avoiding the location or implementing extensive security measures.
The risk factors section lists specific concerns identified during the analysis. Each factor includes a description of the risk, its severity level, evidence from the historical data, and recommendations for mitigation. Common risk factors include high incident frequency if the area experiences more incidents than regional or global averages, specific threat types that are prevalent like terrorism, crime, or political violence, recent incident trends such as increasing frequency or severity, proximity to previous significant incidents, regional instability affecting the broader area, and infrastructure concerns like limited emergency services or poor transportation safety.
The incident history section shows recent incidents in the assessment area. This provides concrete evidence supporting the risk score and helps you understand specific events that have occurred. For each incident, you see when it happened, what category it falls into, the severity level, a brief description, and its distance from your assessment center point.
The recommendations section is perhaps the most actionable part of the assessment. Based on identified risks, the system generates specific advice for managing security in the assessed location. Recommendations might include security measures to implement, areas or activities to avoid, communication plans and emergency contacts, travel timing considerations, emergency evacuation routes and procedures, and local resources for security support.
Saving and Sharing Assessments
After reviewing an assessment, you'll typically want to save it for future reference or share it with colleagues or stakeholders. Click "Save Assessment" and provide a descriptive name like "Jakarta Office Location Assessment - Q2 2025" or "Dubai Travel Security - March Conference." Add any notes or additional context that will help you or others understand the assessment's purpose and findings. The assessment is saved to your organization where team members can access it, reference it in security planning, update it as conditions change, and incorporate it into reports and briefings.
Sharing assessments is straightforward. You can share with team members through the platform, giving them access to the full interactive assessment. You can export as PDF to create a professional document for emailing to stakeholders or including in presentations. You can include in reports by incorporating the assessment into larger security reports or travel briefings. For sensitive assessments, you can control access through organizational permissions.
The Risk Map
The Security Assessment section also includes a global risk map that provides a high-level view of security conditions worldwide. This map color-codes countries based on overall incident rates and severity, helps identify high-risk regions that might require extra security attention, supports strategic planning by revealing geographic patterns, and enables comparison between different potential locations.
The risk map uses incident density, average incident severity, trend direction, and type of incidents to calculate country-level risk scores. Remember that this is a broad generalization—conditions within large countries vary enormously. Use the map for initial screening and strategic overview, but always create specific assessments for actual locations you'll be visiting or operating in.
Managing Your Assessment Library
As you create more assessments over time, you build a valuable library of security intelligence for locations relevant to your organization. The assessment management interface lets you view all assessments created by you or your team members, sort and filter by location, date, or risk score, search for specific assessments, update existing assessments with new data, archive old assessments that are no longer relevant, and track assessment history to see how risk levels change over time.
Many organizations create standing assessments for key locations where they regularly operate or travel, updating them quarterly or when significant incidents occur. This creates an ongoing security baseline and quickly highlights when conditions change.
Organization Management
Building and Leading Your Security Team
For enterprise administrators, organization management is where you control team composition, configure organizational settings, manage subscriptions and billing, and establish the collaborative environment your security team needs to succeed. RiskMize is designed to support organizations from small teams of just a few users to large enterprises with hundreds of security professionals across multiple departments and regions.
Your Organization Dashboard
The organization dashboard provides a comprehensive overview of your team, subscription, usage, and organizational resources. Access it by clicking "Enterprise" in the main menu (for enterprise admins) or by navigating to the organizations section in the admin panel (for super admins managing multiple organizations).
The overview section shows your organization's essential information including the official organization name, current subscription status, expiration date if applicable, number of active team members, storage usage for shared resources, and contact information. Quick action buttons provide one-click access to common tasks like inviting new team members, managing settings, viewing billing information, and generating organizational reports.
The team activity feed shows recent actions taken by team members—who logged in recently, what assessments were created, what incidents were viewed, and what reports were generated. This visibility helps managers understand how the platform is being used and ensures team members are staying engaged with security intelligence.
Configuring Organization Settings
The settings page is where you define how your organization operates within RiskMize. Basic information includes your organization name which appears throughout the interface, your industry sector for better content customization, organization size indicating number of employees, your official website, and a primary contact email for important communications.
Address information includes street address, city, state or province, postal code, and country. This information is used for billing, regional customization, and regional incident filtering if you want to prioritize incidents near your locations.
Subscription details show your current plan type, how many user seats you have, when your subscription renews, and what features are included in your plan. If you're approaching your seat limit or your renewal date, clear indicators help you take action before disruption occurs.
Branding settings (available for larger enterprise plans) let you customize the platform's appearance for your organization. Upload your organization logo to appear in the header, set brand colors to customize the interface theme, customize email templates with your branding for invitations and reports, and configure custom domains for white-label access where users see your brand rather than generic RiskMize branding.
Inviting Team Members
Building your security team in RiskMize is straightforward. Navigate to the Team section and click "Invite New Member." The invitation form asks for the new member's email address, which must be unique and not already associated with another RiskMize account in your organization. Optionally provide their first and last name—while not required, this makes the invitation more personal and helps with team member identification later.
The most important decision is selecting the appropriate role for the new member. Most team members should be invited as enterprise users, which gives them full access to all organizational features and shared resources without administrative capabilities. This role is perfect for security analysts, operations staff, and other team members who consume security intelligence. Invite someone as an enterprise admin only if they need to manage the team, control organizational settings, or handle billing. This role should be reserved for security leadership and those with explicit management responsibilities.
You can include a personalized message in the invitation. This is optional but recommended, especially when inviting people who might not be familiar with RiskMize. A message like "Welcome to our security team! RiskMize will help us collaborate on threat intelligence and security assessments. Click below to accept the invitation and create your account." adds context and makes the invitation more welcoming.
Click "Send Invite" and the invitation is dispatched immediately. The recipient receives an email with the subject line "You've been invited to join [Your Organization Name] on RiskMize." The email includes information about your organization, explains what RiskMize is, clarifies what role they're being assigned, and provides a prominent button to accept the invitation. Invitations remain valid for seven days, giving recipients plenty of time to respond without being open indefinitely.
Track invitation status in the team management interface. You'll see pending invitations that haven't been accepted yet, accepted invitations where the member has joined, and expired invitations that weren't accepted within the seven-day window. For pending invitations, you can resend the invitation if the recipient didn't receive it or reports they can't find the email, or cancel the invitation if you made a mistake or circumstances changed.
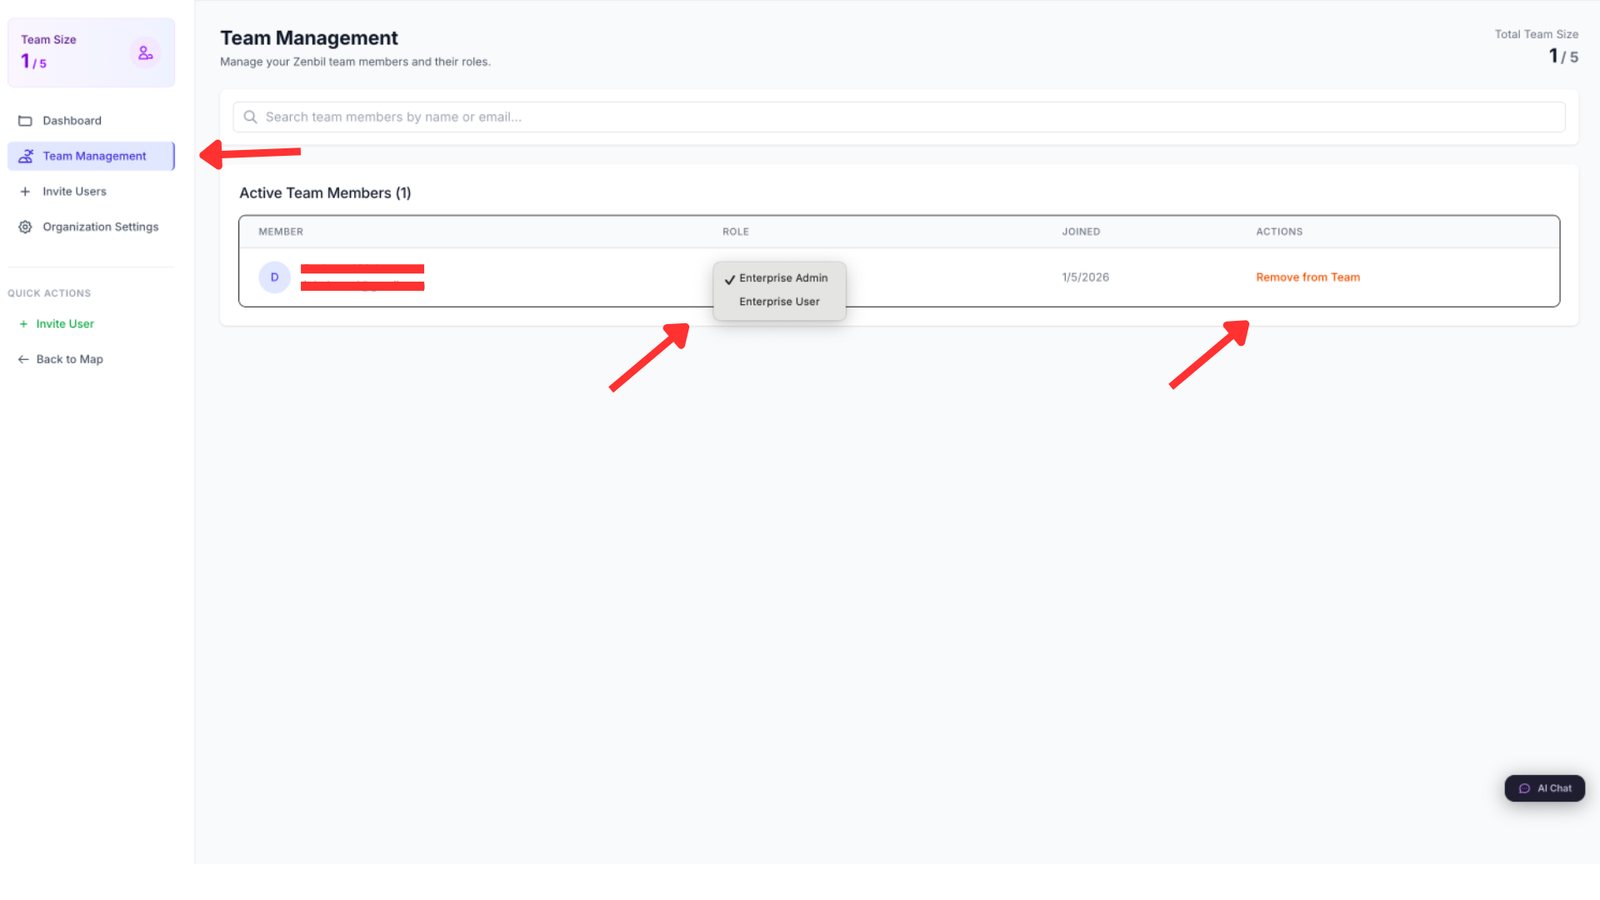
Managing Team Members
Once your team is assembled, ongoing management ensures everyone has appropriate access and the team composition remains current. The team list shows all current members with their name, email address, role, join date, and last login time. This visibility helps you see who's actively using the platform and who might need training or encouragement.
To modify a team member's role, click their name to open their profile, select "Change Role" from the actions menu, choose the new role from the dropdown, and confirm the change. The member is notified of their role change, and their permissions are updated immediately. Common role changes include promoting an enterprise user to enterprise admin when they take on management responsibilities, or adjusting roles as people move between departments or change responsibilities.
Sometimes you need to temporarily suspend a team member's access without permanently removing them from the organization. The deactivate function is perfect for this. Locate the member in the team list, click their profile, select "Deactivate," and confirm the action. The member immediately loses access to the platform but remains in your organization with all their historical activity preserved. They can be reactivated at any time by selecting "Reactivate" from the same menu. This is useful when someone goes on extended leave, temporarily moves to a role that doesn't require RiskMize access, or when you need to enforce security policies around inactive accounts.
Permanent removal is available when someone leaves your organization entirely. Select the member, choose "Remove from Organization," and confirm. The member is completely removed from your organization, loses all access to organizational resources, and can no longer log in to the organizational account. Their historical activity remains in audit logs but they no longer appear in the team list. If you need them back in the future, they must be invited again as if they were a new member.
Bulk Team Management
For larger organizations or when onboarding multiple people simultaneously, bulk operations save substantial time. Bulk invitation lets you invite many team members at once by uploading a CSV file. Prepare a spreadsheet with columns for email, first name, last name, and role. Save it as CSV format. Upload the file through the bulk invite interface. Review the list of members to be invited. Confirm to send all invitations simultaneously.
The system processes each row, validates email addresses, checks for duplicates, creates invitation records, and sends invitation emails. A summary report shows how many invitations were successful, any errors or problems, and recommendations for addressing issues.
Organization Billing and Subscription
Enterprise admins have access to billing information and can manage subscription details. The billing dashboard shows your current plan details, next billing date and amount, payment method on file, billing history with downloadable invoices, and usage statistics showing team size and feature utilization.
To update your payment method, navigate to billing settings, click "Update Payment Method," enter new credit card details, and save. The new card will be used for future billing cycles. To change your subscription plan, view available plans and their features, select the plan that best fits your needs, review pricing including any prorated charges or credits, and confirm the change. Plan changes take effect immediately with prorated billing adjustments.
If your organization grows and you need more user seats, you can add seats through the billing interface. Specify how many additional seats you need, review the cost (typically prorated until your next renewal), and confirm the purchase. The new seats are immediately available for inviting additional team members.
User Management
Personalizing Your RiskMize Experience
Your user profile and settings control how RiskMize works for you personally, separate from organizational settings. Taking time to configure your personal preferences ensures the platform works exactly how you want it to and provides the information you need in the format that's most useful to you.
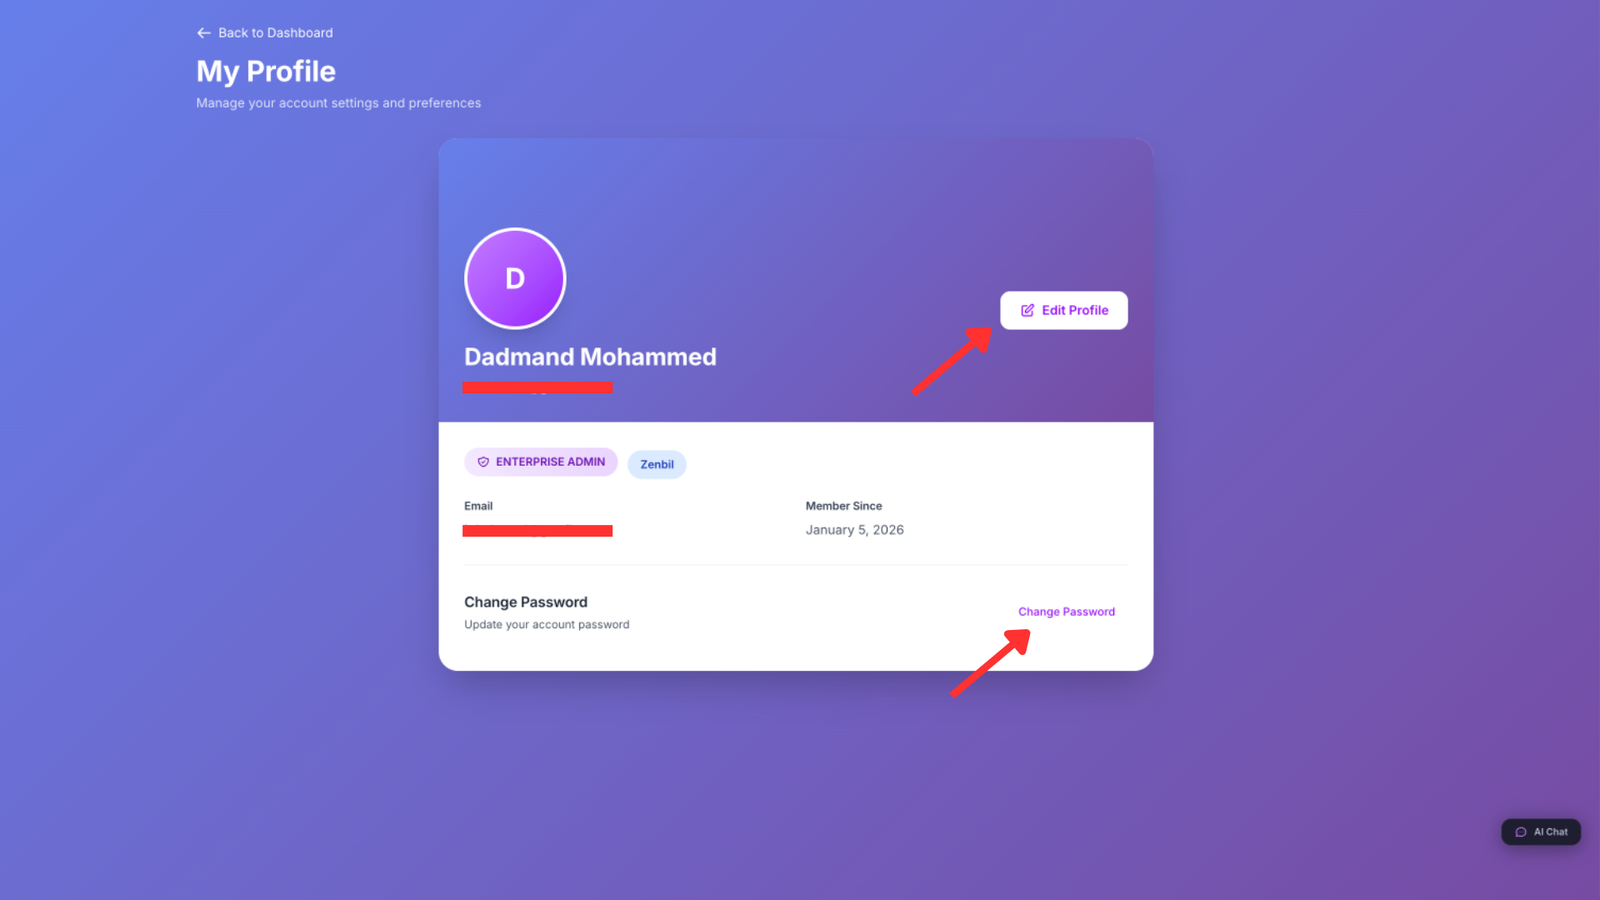
Accessing Profile Settings
Click your profile icon or avatar in the top right corner of the dashboard (on desktop) or select "Profile" from the main menu (on mobile). This opens your personal profile page where you can view and edit your information, review your security settings, configure notification preferences, and manage connected accounts and integrations.
Personal Information
The basic information section contains details about you as a user. Your first name and last name appear throughout the interface and in collaborative features like comments and assessments. Your email address is your login username and primary contact method—changing it requires verification of the new address. Your phone number is optional but useful for account recovery and urgent security notifications. Your job title and department help other team members understand your role and responsibilities. Your location including city and country helps the system customize content and default settings. Your time zone ensures all dates and times display correctly in your local time.
To update any of this information, click "Edit Profile," modify the fields you want to change, and click "Save Changes." Most changes take effect immediately, though email address changes require verification through a link sent to your new address to confirm you control it.
Security Settings
Account security is crucial, especially for a platform handling sensitive security intelligence. The security settings panel provides tools to protect your account from unauthorized access.
Changing your password is straightforward. Navigate to the security section, click "Change Password," enter your current password to verify it's really you, enter your new password meeting the strength requirements, confirm the new password by typing it again, and click "Update Password." You're logged out of other devices and must log back in with the new password, ensuring that if someone else had access to your account, they no longer do.
Strong passwords are essential. RiskMize requires at least eight characters, though twelve or more is better. Include a mix of uppercase and lowercase letters, numbers, and special characters. Avoid common words, personal information, or patterns. Consider using a passphrase—a sequence of random words—which is both strong and memorable.
Two-factor authentication adds a critical additional layer of security. Even if someone obtains your password, they cannot access your account without the second authentication factor. To enable two-factor authentication, navigate to security settings, click "Enable Two-Factor Authentication," and choose your preferred method. SMS authentication sends a code to your phone via text message each time you log in. Authenticator app authentication uses apps like Google Authenticator or Authy to generate time-based codes. Email authentication sends codes to your email address.
If you choose authenticator app, the system displays a QR code. Open your authenticator app, add a new account, scan the QR code, and the app will begin generating six-digit codes that refresh every thirty seconds. Enter the current code to verify everything is working correctly. The system provides backup codes—one-time-use codes that work even if you lose your phone or authenticator device. Download and store these codes securely. Print them out, keep them in a password manager, or store them somewhere safe. If you lose access to your two-factor device, these codes will save you from being locked out of your account.
The active sessions panel shows all devices where you're currently logged in. You see the device type and browser, the IP address, the geographic location based on IP, and when that session last had activity. If you see a session you don't recognize, click "Revoke" to immediately log out that device. This is useful if you logged in on a public computer and forgot to log out, or if you suspect unauthorized access.
Notification Preferences
RiskMize can notify you about various events and updates, but we understand that too many notifications become noise rather than signal. The notification preferences panel lets you control exactly what you're notified about and how.
Email notifications can include alerts for new incidents in areas you're monitoring, security alerts for high and critical severity incidents, weekly digest summaries, organization updates and announcements, and system announcements about new features or maintenance. For each type, you can enable or disable it entirely, or choose the frequency—immediately as events occur, as a daily digest combining multiple notifications, or as a weekly summary.
In-app notifications appear within the RiskMize platform when you're logged in. These can include real-time incident alerts, mentions by other team members in comments or discussions, completed reports and assessments, and system messages. In-app notifications generally don't interrupt your work but appear as badges or indicators you can check when convenient.
After configuring your preferences, click "Save Notification Settings" to apply your choices. The system respects your preferences immediately, so you'll only receive notifications you've explicitly enabled.
Language and Regional Settings
RiskMize supports multiple languages and regional formats to serve users around the world. In the settings panel, you can select your preferred language from supported options including English, Arabic with right-to-left text support, and other languages depending on your deployment.
Regional settings control how dates, times, distances, and temperatures display. Choose your country to set regional defaults. Select your time zone from a comprehensive list—this is crucial for ensuring incident times display correctly relative to your location. Choose distance units (miles or kilometers), temperature units (Fahrenheit or Celsius), and date format (MM/DD/YYYY, DD/MM/YYYY, or ISO format).
These settings affect only your personal view. Other team members can have different preferences without conflict. An American user might see incidents timestamped in Eastern time with dates formatted month-day-year, while a European colleague viewing the same incidents sees Central European time with dates formatted day-month-year. Each user's experience is optimized for their region while everyone works with the same underlying data.
Settings
Platform Configuration
Beyond personal user settings, RiskMize provides system-wide settings that control how the platform behaves and appears. The settings available to you depend on your role—standard users have minimal settings, while administrators can configure extensive platform options.
General Settings
General settings control basic platform behaviors. Default dashboard view determines what you see when you first log in—the main dashboard with map and incident feed, the analytics dashboard, the organization overview (for enterprise users), or your last visited page. Default map style sets whether the map initially displays street view, satellite imagery, or terrain. Default zoom level and center position specify where the map initially focuses. Incident clustering determines whether nearby incidents are automatically grouped on the map.
Incident display settings control how incidents appear in the feed. Set the number of incidents per page, choose the sort order (newest first or oldest first), determine whether incident images appear in the feed, and set how often the feed automatically refreshes with new incidents.
Privacy and Data Sharing
Privacy settings give you control over how your data is used within RiskMize. Usage analytics sharing determines whether anonymous usage statistics help improve the platform. Analytics cookies enable or disable tracking cookies for platform analytics. Third-party integrations control whether you allow connections to external services. Profile visibility determines who can see your profile—all users, only organization members, or only you.
Data retention settings (for enterprise admins) control how long historical data is kept. Set retention periods for incidents, assessments, reports, and activity logs. Export data before retention periods expire if you need long-term archives.
Accessibility Options
RiskMize includes accessibility features to support users with different needs. High contrast mode increases visual contrast for better readability. Large text mode increases default font sizes. Keyboard navigation enhancement improves support for keyboard-only navigation. Screen reader optimization improves compatibility with screen reading software. Reduced motion minimizes animations and transitions for users who prefer less visual movement.
Exporting Data
Taking Your Intelligence With You
Export capabilities ensure that the security intelligence you gather in RiskMize isn't trapped in the platform. Whether you need to include incident data in a presentation, perform advanced analysis in specialized tools, share information with stakeholders who don't have RiskMize access, or comply with data retention and archiving policies, robust export tools make it simple.
Quick Export from Dashboard
The fastest way to export data is directly from your current dashboard view. This captures exactly what you're looking at, respecting all filters and date ranges you've applied. Click the "Export" button in the header or menu. The system analyzes your current view—what incidents are visible, what filters are applied, what date range is selected—and prepares to export that exact data set.
Choose your desired format. CSV creates a comma-separated values file perfect for opening in Excel, Google Sheets, or other spreadsheet software. Each incident becomes a row, and columns contain the various incident fields like title, description, date, location, category, and severity. JSON produces a structured data format ideal for developers or for importing into other software systems. PDF generates a formatted document with incidents listed clearly, suitable for printing or sharing via email. Excel creates an XLSX file with formatted tables, multiple sheets for different views, and embedded charts if applicable.
Click "Download" and the file is generated and downloaded to your browser's download folder within seconds. The exported file is named automatically with the current date to help you keep exports organized.
Custom Export Configuration
For more control over what's exported and how it's formatted, use the custom export interface. Click "Export" then "Custom Export" to access the advanced configuration panel.
Data selection lets you specify exactly what to include. Choose incident types by selecting one or more categories. Select geographic regions by choosing countries, regions, or using coordinates to define a bounding box. Set precise date ranges with start and end dates. Filter by severity to include only certain levels.
Field selection determines what information about each incident is included in the export. The title is usually essential, but you might skip the full description to reduce file size for large exports. Date and time, location details (country, city, coordinates), category, severity level, source URL, casualty information, and status can all be individually included or excluded. Smaller exports are faster to generate and easier to work with, so include only what you actually need.
Sort order determines how incidents are arranged in the export. Date newest to oldest is the default, showing most recent incidents first. Date oldest to newest is useful for chronological analysis. Severity high to low prioritizes the most serious incidents. Location alphabetical sorts by country then city for geographic analysis.
After configuring your custom export, choose the output format and click "Generate Export." More complex exports may take longer to prepare, especially if you're exporting thousands of incidents with full details. A progress indicator shows the system is working. When ready, click the download link to retrieve your file.
Understanding Export Formats
Each export format serves different purposes, and understanding the strengths of each helps you choose appropriately.
CSV exports are ideal when you need raw data for analysis in spreadsheet software or other analytical tools. The format is simple, universal, and supported by virtually every data tool. CSV files are plain text, meaning they're compact and fast to generate even for large datasets. They're perfect for importing into Excel for pivot tables and analysis, loading into business intelligence tools, importing into databases, or processing with custom scripts. The downside is that CSV files have no formatting—no colors, no fonts, no embedded images—just pure data.
JSON exports are the choice for developers and technical users. JSON preserves the hierarchical structure of incident data, supporting nested information like location objects containing country, city, and coordinates. JSON is easily parsed by programming languages and is the native format for web APIs. Use JSON when integrating with other software systems, processing data with Python, JavaScript, or other languages, feeding data into web applications, or building custom analytical tools. JSON files are larger than CSV but much more flexible and structured.
PDF exports create professional-looking documents ready to share with stakeholders, include in presentations, print for physical distribution, or archive for compliance. PDFs maintain formatting, colors, fonts, and layouts. They can include maps, charts, and logos. The trade-off is that PDFs aren't designed for data analysis—you can't easily manipulate the data or import it into other tools. Use PDF for human consumption, not machine processing.
Excel exports combine the data accessibility of CSV with the formatting and presentation of PDF. XLSX files can contain multiple sheets—perhaps one sheet with the incident list, another with summary statistics, and a third with charts. Excel supports formatted tables, conditional formatting, formulas, and embedded visualizations. This format is perfect for sharing with business users who want both the raw data and summary presentations, creating sophisticated reports with multiple views, preserving formatting while maintaining data accessibility, and providing the most flexible format for non-technical users.
Scheduled Automated Exports
Enterprise users and administrators can configure scheduled exports that run automatically without manual intervention. This is invaluable for regulatory compliance requiring regular data exports, maintaining offline archives and backups, distributing intelligence to stakeholders on a regular schedule, or feeding data into external systems automatically.
Access the scheduled exports interface through settings or the export menu. Click "Create Schedule" to configure a new automated export. Give it a descriptive name like "Weekly Incident Archive" or "Daily Critical Incidents Export." Set the frequency to daily, weekly, or monthly. Specify the exact day and time for execution—the system will run the export at this time regardless of whether anyone is logged in.
Configure the export parameters exactly like a custom export—what data to include, what fields to export, how to sort the results, and what format to use. Instead of downloading the file, specify how it should be delivered. Email delivery sends the export to one or more email addresses as an attachment. FTP upload transfers the file to an FTP server automatically. Cloud storage integration can save to Dropbox, Google Drive, or other services if configured. Webhook notification can trigger your own systems when the export is complete, providing a URL to download the file.
Save the schedule and the system takes over, generating and delivering exports automatically on the configured schedule. You receive email confirmations when exports complete successfully or notifications if problems occur. View scheduled exports to see upcoming runs, review execution history, temporarily pause a schedule without deleting it, and edit schedules to change parameters or delivery settings.
Admin Panel
Platform Administration and Management
The admin panel is your control center for managing the RiskMize platform, users, organizations, content, and system settings. This powerful interface is available to editors, finance admins, super admins, and sultan admins, with different features visible based on your specific role and permissions.
Accessing the Admin Panel
Click "Admin" in the main navigation menu or select it from the hamburger menu on mobile devices. The admin panel opens with a dashboard showing platform statistics, recent activity, quick actions, and system health indicators. The navigation sidebar provides access to different administrative sections—users, organizations, incidents, billing, reports, settings, and more depending on your role.
The admin panel interface is designed for efficiency with clear navigation, search and filtering throughout, bulk actions for managing multiple items, detailed views for drilling into specifics, and comprehensive logging for accountability.
Admin Dashboard Overview
The admin dashboard provides an at-a-glance view of platform health and activity. Key statistics show total registered users, active users in the last twenty-four hours, total incidents in the database, new incidents added today, number of organizations, and current system uptime. These metrics help administrators understand platform usage and identify potential issues.
Quick actions provide one-click access to common administrative tasks. Create a new user account, establish a new organization, add an incident to the database, send a system-wide announcement, and generate administrative reports. These shortcuts save time when performing frequent tasks.
Recent activity feeds show the latest user logins, recently created incidents, new user registrations, and significant system events. This real-time visibility helps administrators stay aware of what's happening across the platform.
User Management
The users section provides comprehensive tools for managing everyone who has access to RiskMize. The user list displays all registered users with columns for name and email, role and permissions, organization membership, account status (active, inactive, trial), join date, and last login. Search and filter tools help you find specific users quickly. Search by name or email, filter by role to see all enterprise admins or all editors, filter by organization to see members of specific groups, filter by status to find trial users or inactive accounts, and sort by join date, last login, or name.
Clicking any user opens their detailed profile showing complete account information, all organization memberships, role history and changes, activity logs showing what they've accessed, created reports and assessments, and administrative actions available to you. Actions you can take depend on your role and the target user's role. Edit user details including name, email, and contact information. Change roles to promote or adjust permissions. Activate or deactivate accounts to enable or disable access. Reset passwords if users are locked out. Send direct emails for important communications. Delete accounts permanently (use with caution).
Creating a new user is straightforward. Click "Create User" in the users section. Enter the required information including email address (must be unique), first and last name, selected role, optionally assign to an organization, and set an expiration date if applicable. Choose whether to send a welcome email with login instructions. Click "Create" and the user account is established immediately. If you sent a welcome email, the user receives instructions for setting their password and logging in.
Organization Management
The organizations section provides control over all enterprise accounts on the platform. The organization list shows each organization's name, primary contact, subscription status (active, trial, expired), number of members, expiration date, and join date. Filtering options help you find organizations by status, by member count, by expiration date, or by name search.
Clicking an organization opens its detailed management page. Organization profile shows name, contact information, address, industry, and size. Membership lists all users in the organization with their roles and join dates. Subscription details show plan type, seat count, expiration date, and billing information. Settings contains organization-specific configurations and branding. Activity logs track organizational actions and usage. From the organization details, you can edit basic information, manage expiration dates to extend or modify subscriptions, add or remove members from the organization, access billing and financial information, view comprehensive activity logs, and delete organizations if necessary (with confirmation).
Creating a new organization is often necessary when onboarding new enterprise customers. Click "Create Organization" to access the setup form. Enter the organization name, select the industry sector, specify organization size, provide primary admin email (this person will be invited to become the organization admin), choose the subscription plan and expiration date, and configure initial settings. Click "Create" and the organization is established. The system automatically sends an invitation email to the designated admin, giving them access to set up their organizational account.
Incident Management for Editors
Editors and higher administrators have comprehensive incident management capabilities. The incidents section shows all incidents in the database with advanced filtering to find specific events, bulk operations for managing multiple incidents, moderation queues for reviewing user submissions, news import tools for automated incident creation, and category management for organizing incident types.
The incident list displays title and summary, date and location, category and severity, visibility (public, organizational, private), source, and creator. Use the powerful filtering system to find incidents by date range, category, country or region, severity level, visibility status, or search terms. Bulk operations let you select multiple incidents and perform actions on all at once including changing visibility settings, adjusting categories, updating severity, or deleting multiple incidents.
The moderation queue is where user-submitted incidents and automatically imported incidents await review before publication. Each pending incident shows extracted information, suggested categorization, confidence score (for automated imports), and the source. You can approve to publish immediately, edit to correct information before publishing, or reject to decline publication. This moderation workflow ensures quality and accuracy while allowing rapid content updates.
Financial Management for Finance Admins
Finance administrators access comprehensive billing and accounting tools through the admin panel. The financial overview dashboard presents total revenue, monthly recurring revenue, outstanding accounts receivable, accounts payable, expense totals, and revenue trends over time.
The invoices section manages billing documents. Generate new invoices for organizations or services, view pending invoices awaiting payment, track paid invoices, send invoice emails to customers, record payments when received, and create payment reminders for overdue accounts. Each invoice shows the customer organization, invoice date and due date, line items with descriptions and amounts, total amount, payment status, and available actions.
The expenses section tracks platform costs. Record expenses with date, category, amount, and description. Attach receipts as documentation. Categorize expenses for reporting. Generate expense reports for management. Expenses might include hosting and infrastructure costs, payment processing fees, third-party service subscriptions, marketing and advertising, development and maintenance, and support and operations costs.
Accounts receivable tracks money owed to you. View all outstanding invoices, see aging reports showing how long invoices have been unpaid, send payment reminders automatically or manually, and record payments when they arrive. Accounts payable tracks money you owe to vendors and service providers. Record bills and payment obligations, schedule payments, mark bills as paid when processed, and track vendor relationships.
Report Management
The reports section provides tools for generating and distributing administrative reports. Pre-built reports include user growth and registration trends, incident statistics and trends, platform usage analytics, financial reports and revenue analysis, and organization reports on retention and activity. Custom report builder lets you create specialized reports selecting specific data points, defining filters and parameters, choosing visualizations, and configuring formatting.
Report scheduling automates regular report generation. Create schedules for daily, weekly, or monthly execution, define recipients for automatic distribution, configure format and delivery method, and monitor execution history. Administrators often create multiple scheduled reports for different audiences—executive summaries for leadership, detailed analytics for operations, financial reports for accounting, and user activity reports for internal monitoring.
System Settings and Configuration
Super administrators and sultan administrators access comprehensive system configuration tools. Platform settings control the platform name and branding, default landing pages, session timeout durations, password policies and requirements, and feature flags enabling or disabling platform capabilities.
Email configuration determines how the platform sends email. Choose the email provider including Sendgrid for transactional email, AWS SES for high-volume sending, SMTP for standard mail servers, or other supported services. Configure the sender address that appears on emails, customize email templates for invitations, reports, and notifications, and test email configuration to ensure it's working correctly.
Security settings establish platform-wide security policies. Configure password requirements for length, complexity, and expiration. Set session timeout after inactivity. Enforce two-factor authentication for all users or specific roles. Configure IP whitelisting to restrict access to certain networks. Enable or disable API access and set rate limits.
Maintenance mode lets you temporarily disable public access for system updates. Enable maintenance mode to show users a friendly message instead of the normal interface. Customize the maintenance message to explain when service will resume. Administrators and specified users can bypass maintenance mode to test changes. Schedule maintenance windows in advance to notify users.
API Key Management (Sultan Admins)
The API keys section (available only to sultan administrators) manages programmatic access to the platform. The key list shows all active API keys, who they're assigned to, what permissions they have, when they expire, and usage statistics. Creating a new API key involves specifying the key name and purpose, selecting permissions carefully—read incidents, create incidents, manage users, or full administrative access, setting an optional expiration date, and generating the key. The system displays the API key once—copy and store it securely because you won't be able to see it again.
From the key management interface, you can view usage statistics showing how frequently each key is being used, revoke keys immediately if compromised or no longer needed, regenerate keys to rotate credentials, and configure rate limits to prevent abuse.
Enterprise Features
Advanced Capabilities for Teams and Organizations
Enterprise organizations have access to advanced features designed specifically for team collaboration, shared intelligence, and coordinated security operations. These capabilities transform RiskMize from an individual intelligence tool into a comprehensive platform for organizational security management.
Enterprise Dashboard and Overview
Enterprise users and administrators see an enhanced dashboard with organizational context. Team activity shows what colleagues are working on, shared incidents relevant to the organization, organizational security assessments, and recent team actions. Usage metrics display organizational incident viewing patterns, most active team members, popular reports and assessments, and platform utilization statistics.
The organization feed aggregates activities across your team showing when team members create or update assessments, when new organizational incidents are added, when scheduled reports are generated, and when team members join or leave. This centralized visibility keeps everyone aligned and aware of team activities.
Team Collaboration on Incidents
While standard users view incidents individually, enterprise teams can collaborate around incidents. Team comments let members discuss incidents directly within the platform. Click any incident and scroll to the comments section. Add a comment with observations, analysis, or questions. Mention team members using the @ symbol to ensure they're notified. Reply to existing comments to create threaded discussions. Comments are visible to all organization members, creating a shared record of analysis and insight.
Incident sharing within organizations goes beyond public visibility. Create organization-specific incidents that only your team can see. Share external incidents with your organization by adding them to your organizational feed. Add organizational tags to categorize incidents for your team. Flag incidents for follow-up or priority attention. This shared context ensures everyone works from the same intelligence picture.
Collaborative Security Assessments
Security assessments become more powerful when teams work together. Shared assessments created by any team member are visible to the entire organization. View assessments created by colleagues, avoiding duplication of effort. Build on each other's work by updating and refining assessments. Comment on assessments to discuss findings. Use assessments as planning tools for coordinated operations.
Assessment templates let you save common assessment configurations for reuse. Create a template for standard travel security assessments, site security evaluations, event planning, or other recurring needs. Templates ensure consistency across your team and speed up assessment creation by pre-configuring standard parameters and settings.
Advanced Reporting and Distribution
Enterprise organizations typically need to distribute security intelligence to stakeholders beyond the immediate security team. Scheduled organizational reports automatically generate and distribute intelligence to predefined recipient lists. Configure multiple report schedules for different audiences. Executive briefings might be weekly summaries focusing on high-severity incidents. Operations reports might be daily detailed briefs for security staff. Board reports might be monthly high-level overviews. Each can have different content, formatting, and recipient lists.
Report customization for enterprise users includes organizational branding on reports, custom report templates matching your format standards, flexible content selection to show what each audience needs, and distribution lists managed by enterprise admins. This ensures stakeholders receive relevant, professionally formatted intelligence without manual effort from your security team.
Data Governance and Compliance
Enterprise plans include enhanced data governance capabilities to meet organizational compliance and policy requirements. Data retention policies let you configure how long different types of data are kept, automatically archive old data, export data before retention periods expire, and comply with regulatory requirements.
Access controls provide granular management of who can see what. Control visibility of organizational incidents, restrict access to sensitive assessments, manage report distribution, and audit access to sensitive information. These controls ensure compliance with need-to-know principles and regulatory requirements.
Audit logging creates comprehensive records of organizational activity. Track who accessed what information, when team members created or modified content, what exports and reports were generated, and administrative actions and configuration changes. Audit logs are essential for compliance, security investigations, and operational oversight.
Integration and API Access
Enterprise organizations often need to integrate RiskMize with other systems in their technology stack. API access lets you programmatically retrieve incident data, create incidents from other systems, manage users and organizational settings, and generate reports automatically. Webhooks provide real-time notifications when incidents are created or updated, high-severity incidents occur, reports are generated, or organizational events happen.
Integration possibilities include feeding RiskMize data into Security Information and Event Management (SIEM) platforms, connecting to business intelligence and visualization tools, integrating with travel management systems, pushing alerts to communication platforms like Slack or Microsoft Teams, and building custom applications on top of RiskMize data.
API Documentation
Programmatic Access to Security Intelligence
The RiskMize API provides robust programmatic access to platform capabilities, enabling integration with other systems, automation of routine tasks, and development of custom applications using RiskMize as a backend intelligence platform.
Getting Started with the API
Before you can use the API, you need an API key. Sultan administrators generate API keys through the admin panel under API key management. Once you have your key, include it in every API request using the Authorization header with the format "Bearer YOUR_API_KEY". All API requests use HTTPS for security and connect to the base URL at your RiskMize domain plus the API path "/api/v1".
All API responses use JSON format with a consistent structure. Successful responses include a success boolean set to true, the requested data in a data field, and metadata like count and pagination information. Error responses include success set to false, an error message describing what went wrong, and an HTTP status code indicating the error type.
Core API Endpoints
The incidents endpoint is the foundation of most API usage. Send a GET request to /api/v1/incidents to retrieve incident data. Supported query parameters let you control what you receive. The limit parameter specifies how many results to return, defaulting to one hundred with a maximum of one thousand. The offset parameter implements pagination by skipping a specified number of results. Filter by category using one or more incident types like terrorism, crime, or natural_disaster. Filter by country with the full country name. Filter by severity level with low, medium, high, or critical. Use from_date and to_date parameters with ISO 8601 formatted dates to specify a date range.
The response includes a success indicator, count showing how many results were returned, total indicating how many incidents match your filters in the entire database, and an array of incident objects each containing id, title, description, date, location with country, city, and coordinates, category, severity, source_url, and visibility status.
Retrieving a single incident uses the endpoint /api/v1/incidents/:id where you replace :id with the actual incident identifier. This returns the complete details for that specific incident including all fields and metadata, related incidents, and full source information.
The statistics endpoint provides analytical data. Send a GET request to /api/v1/stats with parameters for from_date and to_date to specify the analysis period, and group_by to aggregate data by category, country, severity, day, week, or month. The response contains aggregated statistics matching your grouping parameters, counts for each group, and trend indicators.
The categories endpoint returns a simple list of all available incident categories. GET /api/v1/categories returns an array of category objects with name, description, and incident count. This is useful for building dynamic filters in your application.
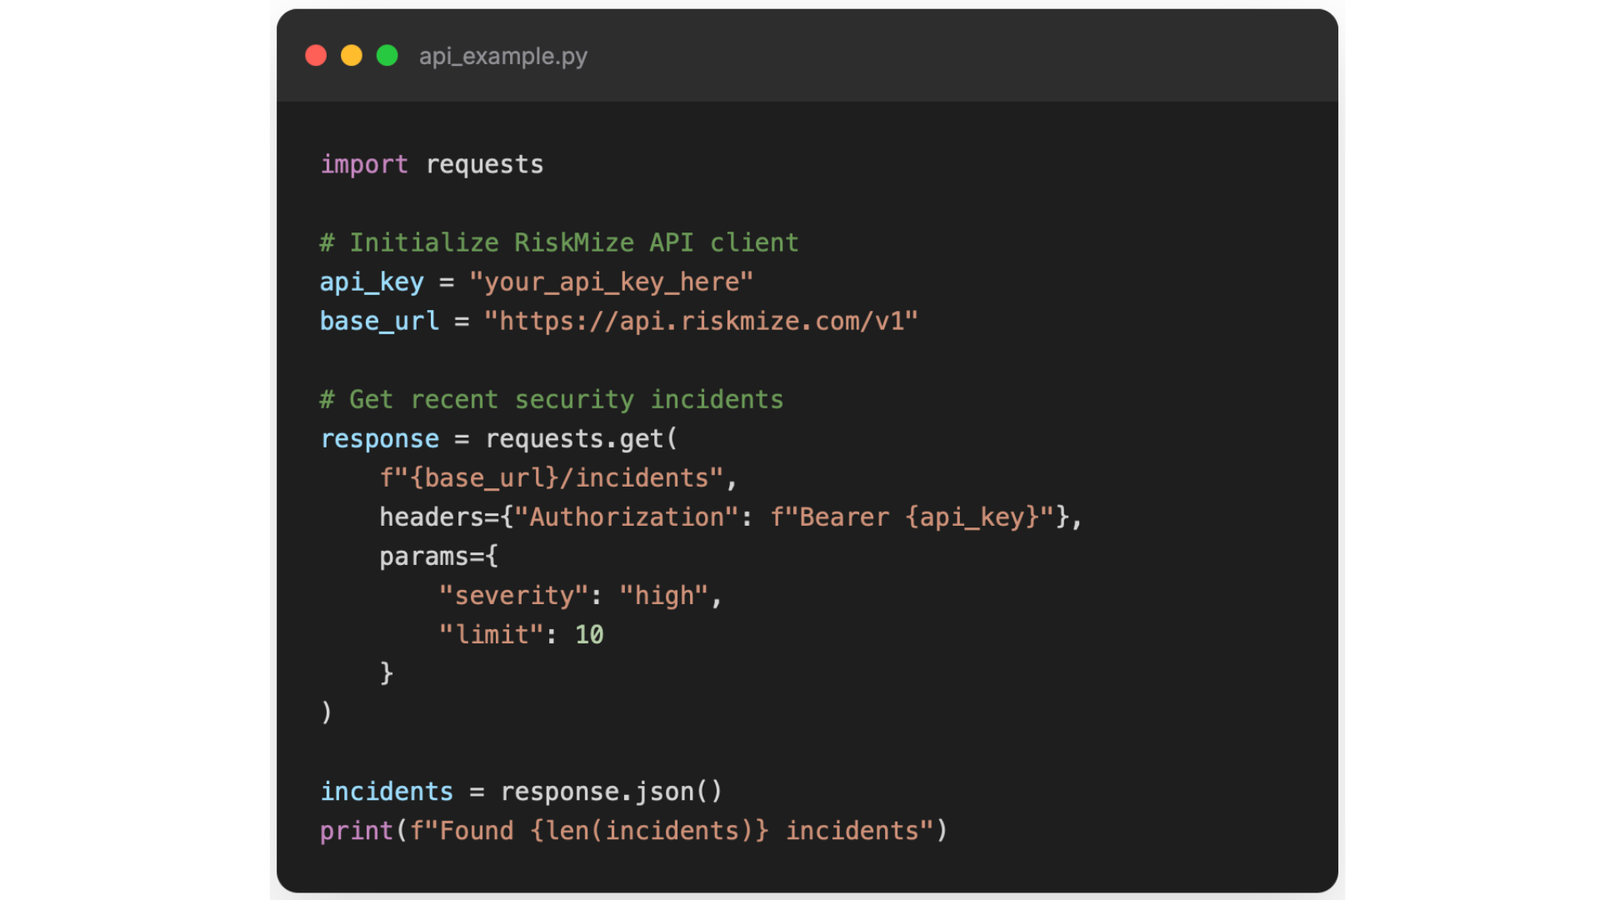
Authentication and Security
Every API request must include valid authentication. Include your API key in the Authorization header formatted as "Bearer YOUR_API_KEY". Without valid authentication, requests receive a 401 Unauthorized response. Keep your API key secure—never commit it to source code repositories, store it as an environment variable or in secure configuration, rotate keys periodically, and revoke compromised keys immediately.
Rate Limits and Quotas
To ensure fair usage and platform stability, the API enforces rate limits based on your subscription level. Standard users receive one hundred requests per hour and one thousand requests per day. Enterprise users get one thousand requests per hour and ten thousand per day. Enterprise administrators receive five thousand requests per hour and fifty thousand per day. Rate limit headers in every response show X-RateLimit-Limit for your total limit, X-RateLimit-Remaining for how many requests you have left, and X-RateLimit-Reset indicating when your limit resets.
If you exceed your rate limit, requests receive a 429 Too Many Requests response. The response includes a Retry-After header indicating how many seconds until you can try again. Implement exponential backoff in your code to handle rate limiting gracefully.
Error Handling
HTTP status codes indicate the outcome of your request. 200 OK means success, and the response contains your requested data. 400 Bad Request indicates invalid parameters or malformed request—check your query parameters and request format. 401 Unauthorized means invalid or missing API key—verify your authentication header. 403 Forbidden means insufficient permissions—your API key doesn't have permission for this operation. 404 Not Found means the requested resource doesn't exist—check the ID or endpoint. 429 Too Many Requests means rate limit exceeded—wait and retry after the specified time. 500 Internal Server Error indicates a server problem—retry with exponential backoff or contact support if it persists.
Error responses include detailed information to help you diagnose and fix problems. The error field contains a human-readable message explaining what went wrong. The details field (when available) provides additional context. The code field contains a machine-readable error code for programmatic handling.
Webhooks for Real-Time Updates
Enterprise organizations can configure webhooks to receive real-time notifications when events occur in RiskMize. Configure webhooks through the admin panel under API keys and integrations. Add your webhook URL where notifications will be sent. Select which events to subscribe to including new incidents created, incidents updated, high-severity incidents added, reports generated, organizational events, or user activities. Test your webhook to ensure it receives notifications correctly.
When a subscribed event occurs, RiskMize sends an HTTP POST request to your webhook URL. The request body contains JSON data with the event type, timestamp when the event occurred, and a data object containing details about the event. For incident events, this includes the complete incident object. For report events, it includes report metadata and a download URL.
Your webhook endpoint should respond with a 200 status code to acknowledge receipt. If your endpoint returns an error or doesn't respond, RiskMize will retry the webhook with exponential backoff up to five times before giving up. Implement webhook verification by validating the signature header included in webhook requests to ensure requests actually come from RiskMize and haven't been tampered with.
Best Practices for API Usage
Implement efficient polling by not requesting data more frequently than necessary—use webhooks for real-time updates instead of constant polling. Cache responses when appropriate to reduce unnecessary requests. Filter requests as narrowly as possible requesting only the data you need and using pagination for large datasets. Handle errors gracefully with proper error handling, exponential backoff for retries, and logging of errors for debugging. Monitor your usage by tracking rate limit headers, logging API usage patterns, and staying well below your rate limits.
Troubleshooting
Common Issues and Solutions
Even the most reliable platforms occasionally present challenges. This section addresses common issues users encounter and provides clear solutions to get you back up and running quickly.
Login and Authentication Issues
Unable to log in with "Invalid credentials" message usually means a simple typo in your email or password. Double-check that your email is spelled correctly including domain. Verify caps lock isn't accidentally enabled. Try typing your password slowly to avoid errors. If you're still unable to log in, use the "Forgot Password" link to reset your password.
If you see "Account not verified," you need to verify your email address before you can log in. Check your email inbox for a message from RiskMize with "Verify Your Email" in the subject line. Look in your spam or junk folder if you don't see it in your inbox. Click the verification link in the email. If you can't find the verification email, return to the login page and click "Resend Verification Email."
Two-factor authentication problems can be frustrating but have straightforward solutions. If your authenticator app code isn't working, verify your device time is correct because time-based codes depend on accurate time. Make sure you're entering the current code, not an expired one—codes refresh every thirty seconds. Try using a backup code if your authenticator isn't working. If you've completely lost access to your two-factor device, contact support with identity verification to disable two-factor authentication on your account.
If you see "Session expired," you've been automatically logged out after a period of inactivity for security. Simply log back in with your credentials. If you're being logged out too frequently, you can adjust session timeout in your settings (if your administrator allows it).
Map and Visualization Issues
If the map doesn't load at all, first check your internet connection to ensure you're online. Try refreshing the page with F5 or the refresh button. Clear your browser cache and cookies, then reload. Try disabling browser extensions temporarily, especially ad blockers which can interfere with mapping services. If the problem persists, try a different browser—Chrome typically offers the best compatibility.
When incidents don't appear on the map despite showing in the incident feed, check your filter settings—you might have filters applied that hide those incidents. Zoom out on the map because incidents might be outside your current view. Look for cluster markers that might be grouping incidents together. Click the "Fit All" button to automatically show all visible incidents.
If the map is slow or laggy, you might be displaying too many incidents at once. Apply filters to reduce the number of visible incidents. Close other browser tabs to free up memory. Check that your internet connection is stable and fast enough. Consider using a different map style—satellite view requires more bandwidth than street view.
Performance and Loading Issues
Slow loading or lag throughout the platform usually relates to your internet connection or browser state. Run a speed test to verify your connection is at least five Mbps. Close unnecessary browser tabs and windows to free up memory and processing power. Clear your browser cache which can become bloated over time. Disable browser extensions to see if one is causing problems. Update your browser to the latest version for performance improvements and bug fixes.
If the dashboard isn't updating with new incidents, verify auto-refresh is enabled in your settings. Try a hard refresh by pressing Ctrl+F5 on Windows or Cmd+Shift+R on Mac to force reload everything. Check your internet connection for stability. Log out completely and log back in to reset your session.
Data Export Issues
When exports aren't working, first verify you have export permissions—free standard users cannot export data. Try reducing your date range or filter selection if you're trying to export a huge dataset. Attempt a different export format—sometimes one format works when another doesn't. Check your browser's popup blocker settings since export downloads can be blocked. Try a different browser if problems persist.
If you see "Export failed" or exports contain no data, confirm incidents match your filter criteria by checking the dashboard first. Verify your date range is correct and includes incident data. Try exporting a smaller dataset to test if file size is the issue. Contact support if the problem continues.
Mobile-Specific Issues
Touch targets feeling too small means you may be using an outdated version. Ensure you're accessing the latest version by clearing your mobile browser cache. Zoom in using browser zoom if necessary. Update your mobile browser to the latest version. Report specific interface elements that are difficult to tap.
If the mobile menu isn't working, try refreshing the page by pulling down from the top. Clear your browser cache and cookies. Force-close and reopen your browser. Try a different mobile browser like Chrome or Safari.
For overall poor mobile performance, close other apps running in the background. Ensure you have sufficient free storage on your device. Update your mobile operating system. Connect to WiFi instead of cellular for better speed.
Organization and Team Issues
Unable to invite team members typically means you're not an enterprise administrator. Contact your organization admin to request administrator role. Check that your organization hasn't reached its seat limit. Verify email addresses are correct and the person doesn't already have an account. Check your organization subscription status hasn't expired.
When team members can't accept invitations, check if the invitation has expired—they last seven days. Resend the invitation to generate a new one. Verify you're sending to the correct email address. Ask them to check spam or junk folders. Have them try accepting from a different device or browser.
Getting Help When You're Stuck
If you've tried the relevant solutions above and still have problems, RiskMize support is here to help. Email support@riskmize.com with your account email, a detailed description of the issue including what you were trying to do and what happened instead, steps to reproduce the problem if possible, any error messages you saw, screenshots or screen recordings demonstrating the issue, and information about your browser, device, and operating system.
Standard support responds within twenty-four to forty-eight hours. Enterprise customers with live chat access can get immediate help during business hours Monday through Friday, nine AM to five PM Eastern. Enterprise administrators with phone support can call for critical issues requiring immediate attention.
When describing your problem, be as specific as possible. Instead of "the map doesn't work," explain "when I click on incident markers on the map, the popup doesn't appear and I see a JavaScript error in my browser console." Specific details help support diagnose and resolve issues much faster.
RiskMize User Documentation
Version 2.0 | December 2025
© 2026 Riskmize. All rights reserved.
For additional assistance:
Email: support@riskmize.com
Website: https://riskos.com